
Fig. 4
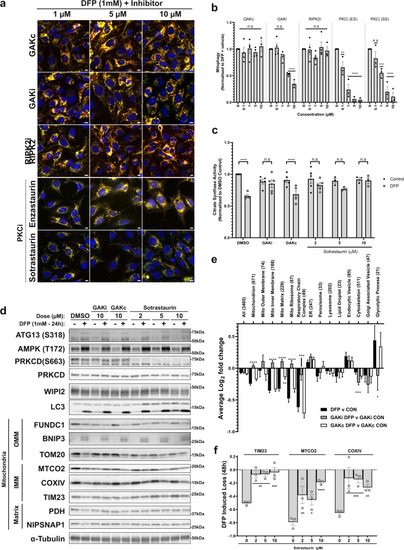
a Fluorescence images of U2OS IMLS cells treated with 1 mM DFP for 24 h in the presence of indicated inhibitors at stated concentrations (1–10 µM). Scale bar = 10 µm b Quantitation of cells treated as in (a) for mean red-only structures normalised to DMSO + DFP control treatment ± SEM. Significance was determined by two-way ANOVA followed by Dunnett’s multiple comparison test to the DMSO + DFP control from a minimum of n = 3 independent experiments. c Citrate synthase activity of U2OS cells treated 24 h ± 1 mM DFP in combination with 10 µM GAKi, GAKc or 2–10 µM sotrastaurin. Values represent mean citrate synthase activity normalised to DMSO control and plotted ± SEM from n = 3 (sotrastaurin 5/10 µm) or n = 5 independent experiments. Significance was determined by two-way ANOVA followed by Sidak’s multiple comparison test. d U2OS cells were treated ± 1 mM DFP 24 h with GAKi or GAKc (10 µM), sotrastaurin (2–10 µM) or DMSO control and western blotted for indicated proteins, including outer mitochondrial membrane (OMM), inner mitochondrial membrane (IMM) or Matrix proteins. e Cellular protein abundance was determined by mass spectrometry. U2OS cells were treated ± 1 mM DFP for 24 h in addition to DMSO, GAKi or GAKc (both 10 µM) and analysed by mass spectrometry. Comparison of mean abundance of GO-annotated proteins between control and DFP-treated samples for each GAKi, GAKc and DMSO control are shown ± SEM from n = 4 independent experiments, value in brackets represent the number of proteins classified in the group by GO analysis. Significance was determined by two-way ANOVA followed by Dunnett’s post-test to the DFP v CON sample. f Cells were treated as in (d) for 48 h and quantified by western blot by normalisation of each target to loading control. The graph represents mean DFP-induced loss of indicated proteins ± SEM from n = 3 independent experiments. Significance is denoted in figure where: *P < 0.05, **P < 0.01, ***P < 0.001, ****P < 0.0001 and n.s. = not significant in all relevant panels. For precise P values, see the source data file. |