
Fig. 2
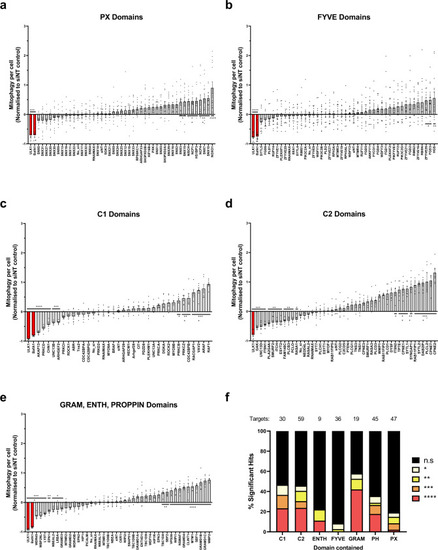
a–e Primary siRNA screen data. U2OS cells were transfected with a pool of three sequence variable siRNA oligonucleotides per gene target (2.5 nM per oligo) for 48 h before the addition of 1 mM DFP for 24 h. Cells were PFA fixed and imaged using a ×20 objective (35 fields of view per well). The red area per cell was normalised to the average of siNT controls and adjusted so that the DFP siNT control was 0 from n = 14 plates (a, b) or n = 6 plates (c–e) ±SEM. siULK1 and BafA1 (red bars) are positive controls. siRNA targets containing similar lipid-binding domains were assayed and plotted together as shown for a PX domains, b FYVE domains, c C1 domains, d C2 domains, e GRAM, ENTH, PROPPIN domains. f Summary of the significance of different lipid-binding domains relative to the total tested from (a–e) proteins containing more than one type of domain are represented in each category. Significance was determined by one-way ANOVA followed by Dunnett’s multiple comparison test to the siNT control where *P < 0.05, **P < 0.01, ***P < 0.001, ****P < 0.0001 and n.s. = not significant in all relevant panels. For precise P values, see the source data file. |