
- Title
-
GAK and PRKCD are positive regulators of PRKN-independent mitophagy
- Authors
- Munson, M.J., Mathai, B.J., Ng, M.Y.W., Trachsel-Moncho, L., de la Ballina, L.R., Schultz, S.W., Aman, Y., Lystad, A.H., Singh, S., Singh, S., Wesche, J., Fang, E.F., Simonsen, A.
- Source
- Full text @ Nat. Commun.
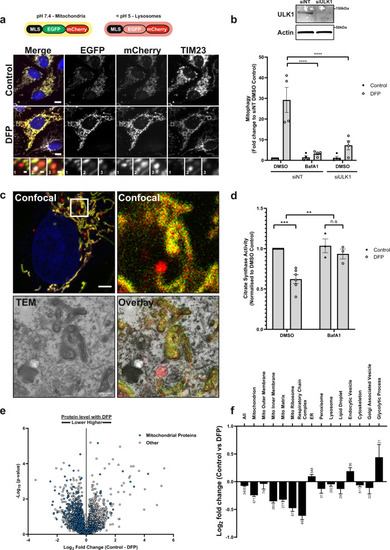
a U2OS cells stably expressing an internal MLS-EGFP-mCherry (IMLS) reporter that is pH-responsive (yellow at neutral, red at acidic pH) were incubated for 24 h ± 1 mM DFP followed by PFA fixation, antibody staining for TIM23 (Alexa Fluor-647) and widefield microscopy. Scale bar = 10 µm, inset = 0.5 µm. b U2OS IMLS cells were transfected with 7.5 nM siRNA non-targeting control (siNT) or siULK1 for 48 h prior to 24 h treatment ± 1 mM DFP in the presence or absence of 50 nM BafA1 for the final 2 h. Western blot from cell lysates shows representative ULK1 knockdown level. The graph represents the mean red-only area per cell from fluorescence images normalised to control DMSO siNT cells ± SEM from n = 4 independent experiments. Significance was determined by two-way ANOVA followed by Tukey’s multiple comparison test. c U2OS IMLS cells treated with 1 mM DFP as in (a) and fixed for CLEM analysis. Inset of the cell area in the white box is shown by confocal analysis and EM section along with EM overlay. Scale bar = 5 µm, inset = 1 µm. d Citrate synthase activity from U2OS cells treated for 24 h ± 1 mM DFP with final 16 h in the presence of 50 nM BafA1 or DMSO, values are normalised to DMSO control from n = 6 (DMSO) or n = 3 (+BafA1) independent experiments ± SEM. Significance was determined by two-way ANOVA followed by Sidak’s multiple comparisons test. e U2OS whole-cell protein abundance was determined by mass spectrometry following treatment ±1 mM DFP 24 h. Mitochondrial proteins identified by GO analysis (term = mitochondrion) are highlighted in blue. f Mean T test difference between control and DFP samples for peptides identified in e matching GO terms related to cellular organelles. Bars represent Log2 fold change (control vs DFP) ± SEM from n = 4 independent experiments, number on bars indicate how many protein targets are included in GO analysis. **P < 0.01, ***P < 0.001, ****P < 0.0001 and n.s. = not significant in all relevant panels. For precise P values, see the source data file. |
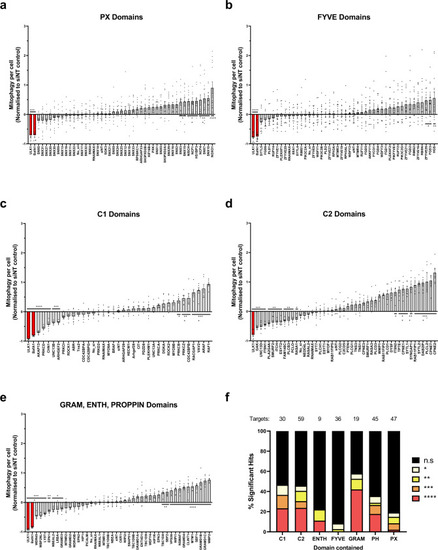
a–e Primary siRNA screen data. U2OS cells were transfected with a pool of three sequence variable siRNA oligonucleotides per gene target (2.5 nM per oligo) for 48 h before the addition of 1 mM DFP for 24 h. Cells were PFA fixed and imaged using a ×20 objective (35 fields of view per well). The red area per cell was normalised to the average of siNT controls and adjusted so that the DFP siNT control was 0 from n = 14 plates (a, b) or n = 6 plates (c–e) ±SEM. siULK1 and BafA1 (red bars) are positive controls. siRNA targets containing similar lipid-binding domains were assayed and plotted together as shown for a PX domains, b FYVE domains, c C1 domains, d C2 domains, e GRAM, ENTH, PROPPIN domains. f Summary of the significance of different lipid-binding domains relative to the total tested from (a–e) proteins containing more than one type of domain are represented in each category. Significance was determined by one-way ANOVA followed by Dunnett’s multiple comparison test to the siNT control where *P < 0.05, **P < 0.01, ***P < 0.001, ****P < 0.0001 and n.s. = not significant in all relevant panels. For precise P values, see the source data file. |
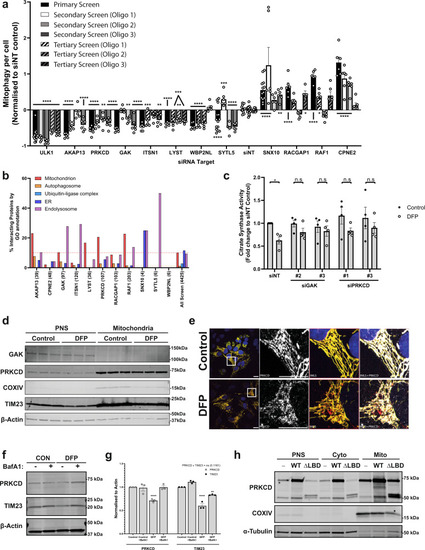
a Summary of significant targets identified across primary, secondary (7.5 nM individual siRNA oligos) and tertiary screens (15 nM each oligo) siRNA screens. Cells were transfected for 48 h prior to 24 h of 1 mM DFP treatment. Bars represent mean fold change in mitophagy relative to the siNT controls ± SEM from n = 12 (siNT, primary + secondary), n = 13 (SNX10, primary), n = 14 (SYTL5 + ULK1, primary), n = 17 (siNT, secondary) or n = 6 (all others) independent plates. Significance was determined by one-way ANOVA followed by Dunnett’s multiple comparison test to the siNT control. b Protein–protein interaction networks for candidate proteins (see “Methods”) were plotted by % of interacting proteins belonging to each highlighted compartment, value in brackets represents total number of interacting proteins. Dashed lines indicate average values from all screened proteins for mitochondria (red) or autophagosome (orange). c siRNA treatment with indicated oligos for 48 h prior to 24 h treatment ± 1 mM DFP and subsequent analysis of citrate synthase activity levels. Values were normalised to the siNT control and plotted ± SEM for n = 4 independent experiments. Significance was determined by two-way ANOVA followed by Sidak’s multiple comparison test. d U2OS cells treated ± 1 mM DFP for 24 h were enriched from a post-nuclear supernatant (PNS) for mitochondria followed by western blotting for the indicated proteins. e U2OS IMLS cells treated ± 1 mM DFP for 24 h followed by PFA fixation and staining for endogenous PRKCD (Alexa Fluor-647). Scale bar = 20 µm. f U2OS cells treated ± 1 mM DFP for 24 h ± 50 nM BafA1 for the final 16 h and blotted for the indicated proteins. g Quantitation of PRKCD and TIM23 levels to β-actin in (f) from n = 3 independent experiments ± SEM. Significance was determined by two-way ANOVA followed by Dunnett’s multiple comparison test to the control. h U2OS cells (−) or those stably expressing PRKCD wild type (WT) or PRKCD ∆C1 ∆C2 (∆lipid-binding domains—LBD) were enriched from a post-nuclear supernatant (PNS) for cytosol and mitochondrial fractions followed by western blotting for the indicated proteins. Representative from n = 2 experiments *P < 0.05, **P < 0.01, ***P < 0.001, ****P < 0.0001 and n.s. = not significant in all relevant panels. For precise P values, see the source data file. |
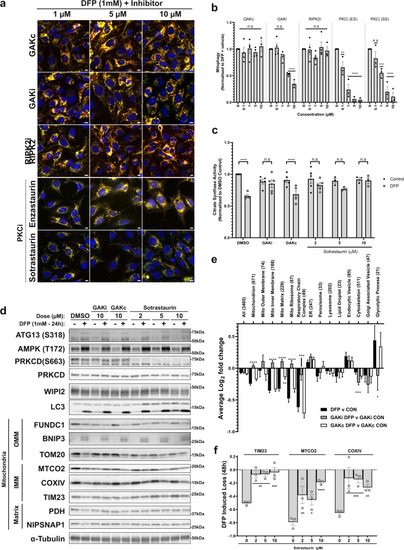
a Fluorescence images of U2OS IMLS cells treated with 1 mM DFP for 24 h in the presence of indicated inhibitors at stated concentrations (1–10 µM). Scale bar = 10 µm b Quantitation of cells treated as in (a) for mean red-only structures normalised to DMSO + DFP control treatment ± SEM. Significance was determined by two-way ANOVA followed by Dunnett’s multiple comparison test to the DMSO + DFP control from a minimum of n = 3 independent experiments. c Citrate synthase activity of U2OS cells treated 24 h ± 1 mM DFP in combination with 10 µM GAKi, GAKc or 2–10 µM sotrastaurin. Values represent mean citrate synthase activity normalised to DMSO control and plotted ± SEM from n = 3 (sotrastaurin 5/10 µm) or n = 5 independent experiments. Significance was determined by two-way ANOVA followed by Sidak’s multiple comparison test. d U2OS cells were treated ± 1 mM DFP 24 h with GAKi or GAKc (10 µM), sotrastaurin (2–10 µM) or DMSO control and western blotted for indicated proteins, including outer mitochondrial membrane (OMM), inner mitochondrial membrane (IMM) or Matrix proteins. e Cellular protein abundance was determined by mass spectrometry. U2OS cells were treated ± 1 mM DFP for 24 h in addition to DMSO, GAKi or GAKc (both 10 µM) and analysed by mass spectrometry. Comparison of mean abundance of GO-annotated proteins between control and DFP-treated samples for each GAKi, GAKc and DMSO control are shown ± SEM from n = 4 independent experiments, value in brackets represent the number of proteins classified in the group by GO analysis. Significance was determined by two-way ANOVA followed by Dunnett’s post-test to the DFP v CON sample. f Cells were treated as in (d) for 48 h and quantified by western blot by normalisation of each target to loading control. The graph represents mean DFP-induced loss of indicated proteins ± SEM from n = 3 independent experiments. Significance is denoted in figure where: *P < 0.05, **P < 0.01, ***P < 0.001, ****P < 0.0001 and n.s. = not significant in all relevant panels. For precise P values, see the source data file. |
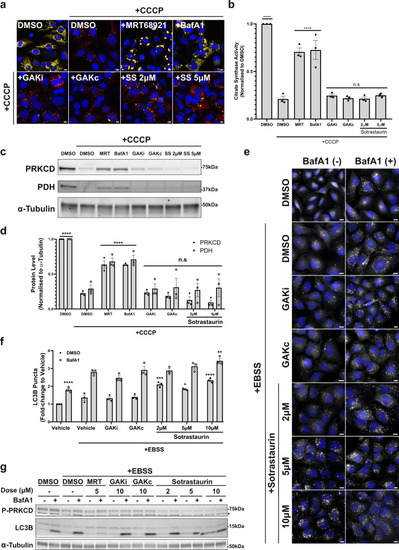
a Representative fluorescence images of U2OS IMLS-PRKN cells treated for 16 h ± 20 µM CCCP and including 10 µM QVD-OPh to promote cell survival in addition to either MRT68921 (5 µM), BafA1 (50 nM), GAKi (10 µM), GAKc (10 µM) or sotrastaurin (2–5 µM). Scale bar = 10 µm. b Cells treated as in a and assayed for citrate synthase activity and normalised to DMSO control. Mean value plotted ± SEM from n = 3 independent experiments, and significance determined by one-way ANOVA followed by Dunnett’s multiple comparisons to the CCCP + DMSO control. c Representative example of western blots from cells treated as in a and blotted for indicated proteins. d Quantitation of PRKCD and PDH levels normalised to from western blots in (c) from n = 3 independent experiments ± SEM. Values represent protein level normalised first to α-tubulin and subsequently normalised to the DMSO control. Significance was determined by two-way ANOVA followed by Dunnett’s multiple comparison test to DMSO + CCCP treatment. e Representative ×20 immunofluorescence images of U2OS cells stained for endogenous LC3B and nuclei (DAPI, blue). Cells were grown in complete media or EBSS (starvation) media for 2 h with the addition of GAKi (10 µM), GAKc (10 µM) or sotrastaurin (2–10 µM) ± 50 nM BafA1, scale bar = 10 µm. f Quantitation of LC3B puncta from (e). The average LC3 puncta per cell were normalised to that of the complete media control and represent the mean ± SEM from n = 3 independent experiments. Significance was determined by two-way ANOVA followed by Dunnett’s multiple comparison test to the EBSS vehicle-treated sample. g Representative western blot of cells treated as in (e) from n = 3 experiments and blotted for indicated proteins where *P-PRKCQ cross-reaction. *P < 0.05, **P < 0.01, ***P < 0.001 and ****P < 0.0001 and n.s. = not significant in all relevant panels. For precise P values, see the source data file. |
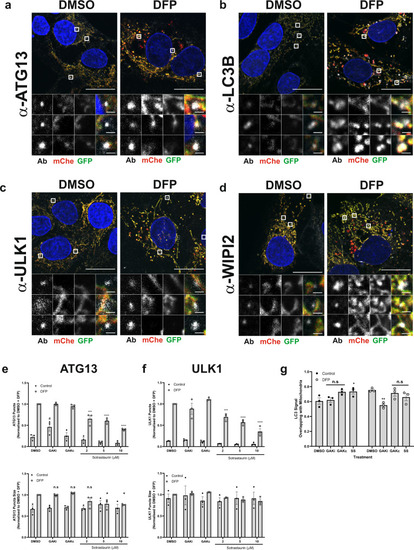
a–d U2OS IMLS cells were treated ± 1 mM DFP for 24 h, fixed and stained for nuclei (DAPI) and the indicated endogenous autophagy markers; a ATG13, b LC3B, c ULK1 or d WIPI2. Representative ×63 images of cells taken by Zeiss LSM710 are shown, scale bar = 10 µm. e, f U2OS cells were treated ± 1 mM DFP for 24 h together with GAKi (10 µM), GAKc (10 µM) or sotrastaurin (2–10 µM), then fixed in PFA before staining for nuclei (DAPI) and the indicated endogenous early autophagy markers; e ATG13, f ULK1. The number and size of puncta formed for each marker were analysed and values obtained were normalised to the DMSO + DFP control. Mean values were plotted from n = 3 independent experiments ± SEM. Significance was determined by two-way ANOVA and Dunnett’s multiple comparisons test to the DMSO + DFP control sample. g U2OS cells were treated ±1 mM DFP for 24 h with GAKi (10 µM), GAKc (10 µM) or sotrastaurin (10 µM) and labelled for mitochondria with MitoTracker red. Co-localisation of LC3 signal with mitochondria was determined by Mander’s co-localisation. Significance was determined by two-way ANOVA and Dunnett’s post-test to the DMSO sample. Where indicated *P < 0.05, **P < 0.01, ***P < 0.001, ****P < 0.0001, n.s. = not significant and #P < 0.05 (to the DMSO control). For precise P values, see the source data file. |
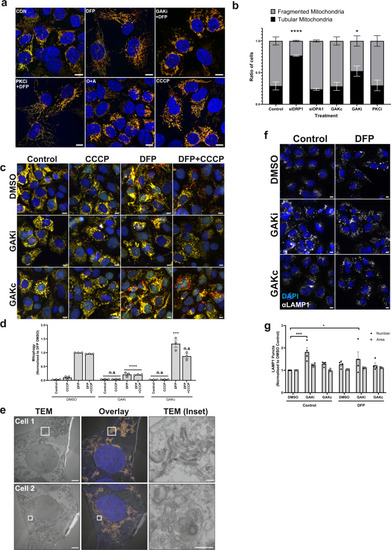
a Representative ×63 images of U2OS IMLS cells taken by Zeiss LSM710 confocal microscopy. Cells were treated ± 1 mM DFP 24 h in addition to GAKi (10 µM), sotrastaurin (PKCi—2 µM), oligomycin and antimycin A (O + A—10 µM and 1 µM, respectively) or CCCP (20 µM), scale bar = 10 µm. b Machine-learning classification of U2OS IMLS cell mitochondrial network as fragmented or tubular (utilising EGFP images, see methods) ± SEM from n = 3 independent experiments after 24 h treatment with GAKi (10 µM), GAKc (10 µM) or sotrastaurin (PKCi—2 µM) compared to 72 h knockdown of non-targeting control, siDRP1 or siOPA1. Significance was determined by two-way ANOVA followed by Dunnett’s post-test to the control treatment. c U2OS IMLS cells were treated as indicated with DMSO, GAKi or GAKc (10 µM each) for 24 h in addition to either DFP (24 h, 1 mM), CCCP (20 µM, 12 h) or in combination. Images obtained by ×20 objective, scale bar = 10 µm. d Quantitation of mean mitophagy per cell from cells treated as in (c) ± SEM from n = 3 independent experiments. Significance was determined by two-way ANOVA followed by Dunnett’s post-test to the equivalent DMSO treatment. e U2OS IMLS cells were treated with 1 mM DFP + 10 µM GAKi for 24 h prior to fixation for CLEM analysis. EM images demonstrate mitochondrial clustering (Cell 1) and an increase in autolysosome structures (Cell 2) induced by GAKi treatment, scale bar = 10 µm, inset = 1 µM. f U2OS cells treated ± 1 mM DFP 24 h in addition to DMSO, GAKi (10 µM) or GAKc (10 µM) were PFA fixed and subsequently stained for endogenous LAMP1. Images acquired at ×20 by widefield microscopy on a Zeiss AxioObserver microscope, scale bar = 10 µm. g Quantitation of LAMP1 structures identified in (f) for size and number and plotted as mean ± SEM from n = 4 independent experiments. Significance was determined by two-way ANOVA followed by Dunnett’s multiple comparisons test to the DMSO control. Significance was denoted where *P < 0.05, ***P < 0.01, ****P < 0.0001 and n.s. = not significant in all relevant panels. For precise P values, see the source data file. |
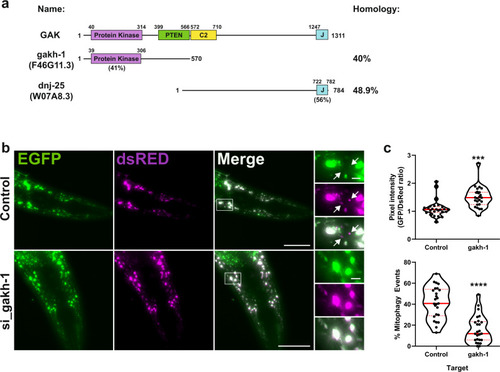
a Schematic representation of GAK domain structure and orthologues gakh-1 and dnj-25 present in C. elegans. Homology values were obtained by protein blast alignment. b In vivo detection of mitophagy in C. elegans. Transgenic nematodes expressing mtRosella in body-wall muscle cells were treated with gakh-1 RNAi or pL4440 control vector. dsRED only structures represent mitochondria in acidic compartments (arrowheads). Scale bar = 50 μm, insets = 5 µm. Representative image from n = 25 worms. c Mitophagy stimulation signified by the ratio between pH-sensitive GFP to pH-insensitive dsRED (n = 25 worms per group, upper panel). Quantification of the frequency of mitochondria undergoing mitophagy (dsRED puncta lacking EGFP co-localisation) are expressed as a percentage of total mitochondria detected (n = 25 worms per group, lower panel). The data are presented as violin plots of individual values with median (red, solid line) and quartiles (red, dashed line) shown. Significance was determined by unpaired two-tailed t test from n = 2 independent experiments, where **P < 0.001 or ****P < 0.0001. For precise P values, see the source data file. |
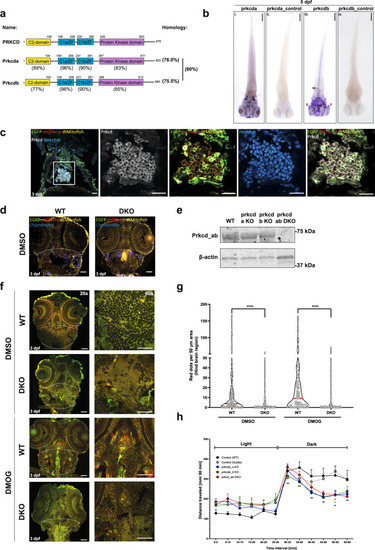
a Overview and schematic diagram of human PRKCD, zebrafish prkcda and prkcdb proteins. Percentage identity of respective domains on comparison with human counterpart shown below the zebrafish domains. Also shown is the percentage identity of the orthologues amongst each other. b Dorsal view of spatial expression pattern of prkcda and prkcdb at 5 dpf as demonstrated by whole-mount in situ hybridisation using a 5’UTR probe. Scale bar = 200 μm. c Representative confocal images of cryosections taken from transgenic tandem-tagged mitofish at 3 dpf, fixed and stained for nuclei (Hoechst) and endogenous Prkcd. The image shows the section of a larval zebrafish hindbrain. Representative ×40 image of the zebrafish hindbrain section was taken on Zeiss LSM 800, scale bar = 20 µm. d Representative ×20 confocal images (Zeiss LSM 800) of cryosections taken from transgenic tandem-tagged mitofish at 3 dpf, fixed and stained for chondroitin sulphate. The markings (white dashed line) represent the hindbrain region, following the chondroitin staining. Scale bar = 50 µm. e Representative immunoblots of Prkcd and β-actin on whole embryo lysates from wild-type and single or double prkcda/prkcdb KO (DKO) animals. f Representative ×20 and ×60 confocal images of cryosections taken from control (guide only) and prkcd_ab DKO transgenic tandem-tagged mitofish larvae treated with DMSO or with DMOG at 3 dpf for 24 h. Images are from within the hindbrain region of the respective larvae as marked (dashed white line). Scale bars = 50 μm. g Quantitation of the number of red puncta from a 50-μm hindbrain region (as marked in f) from control and prkcd_ab DKO tandem-tagged mitofish larvae. Plots demonstrate data distribution and median value (red line). Significance was determined by two-way ANOVA followed by Tukey’s post-test to compare all groups. h Motility analysis of zebrafish embryos at 5 dpf using the “Zebrabox” automated videotracker (Viewpoint). The assay was carried out during daytime and consisted of one cycle of 30 min exposure to light followed by 30 min of darkness. Data represent mean distance moved ± SEM. Each group consisted of 43–124 larvae from n = 9 independent experiments. Significance was determined by two-way ANOVA followed by Dunnett’s post-test to the control (WT). Significance are denoted where *P < 0.05, **P < 0.01, ***P < 0.001, ****P < 0.0001, n.s. = not significant. For precise P values, see the source data file. |