
Fig. 5
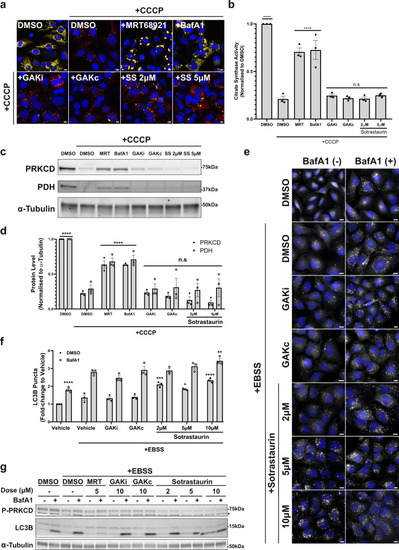
a Representative fluorescence images of U2OS IMLS-PRKN cells treated for 16 h ± 20 µM CCCP and including 10 µM QVD-OPh to promote cell survival in addition to either MRT68921 (5 µM), BafA1 (50 nM), GAKi (10 µM), GAKc (10 µM) or sotrastaurin (2–5 µM). Scale bar = 10 µm. b Cells treated as in a and assayed for citrate synthase activity and normalised to DMSO control. Mean value plotted ± SEM from n = 3 independent experiments, and significance determined by one-way ANOVA followed by Dunnett’s multiple comparisons to the CCCP + DMSO control. c Representative example of western blots from cells treated as in a and blotted for indicated proteins. d Quantitation of PRKCD and PDH levels normalised to from western blots in (c) from n = 3 independent experiments ± SEM. Values represent protein level normalised first to α-tubulin and subsequently normalised to the DMSO control. Significance was determined by two-way ANOVA followed by Dunnett’s multiple comparison test to DMSO + CCCP treatment. e Representative ×20 immunofluorescence images of U2OS cells stained for endogenous LC3B and nuclei (DAPI, blue). Cells were grown in complete media or EBSS (starvation) media for 2 h with the addition of GAKi (10 µM), GAKc (10 µM) or sotrastaurin (2–10 µM) ± 50 nM BafA1, scale bar = 10 µm. f Quantitation of LC3B puncta from (e). The average LC3 puncta per cell were normalised to that of the complete media control and represent the mean ± SEM from n = 3 independent experiments. Significance was determined by two-way ANOVA followed by Dunnett’s multiple comparison test to the EBSS vehicle-treated sample. g Representative western blot of cells treated as in (e) from n = 3 experiments and blotted for indicated proteins where *P-PRKCQ cross-reaction. *P < 0.05, **P < 0.01, ***P < 0.001 and ****P < 0.0001 and n.s. = not significant in all relevant panels. For precise P values, see the source data file. |