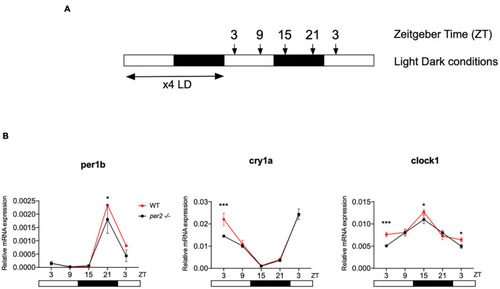
Circadian clock gene expression analysis in per2 KO and WT larvae. (A) Schematic representation of the experimental design. The horizontal bars represent the lighting conditions before and during sampling; white and black boxes indicate light and dark periods, respectively; the arrows show the sampling times. WT and per2 mutant larvae were kept 4 dpf in LD cycle (12 h light-12 h dark) conditions. On the 5th dpf, total RNA was extracted from pools of larvae collected at 6-h intervals during a sampling window of 24 h. (B) qRT-PCR analysis of mRNA expression levels of the circadian clock genes (clock1, cry1a, and per1b) in WT and per2 mutant larvae. Mean mRNA relative expression (n = 2–3) ± SD is plotted on the y-axis, while zeitgeber time (ZT) is plotted on the x-axis. ZT0 corresponds to lights-on, ZT12 to lights-off. A significant, small decrease in expression level was observed in mutants in all three genes (***p < 0.001, ANOVA genotype effect, Table 1). Asterisks represent levels of significance in comparing the two genotypes at each time point individually, corrected by Sidak’s method (***p < 0.001, *p < 0.05).
|
