FIGURE

FIGURE 10

ID
ZDB-FIG-210923-17
Publication
Ruggiero et al., 2021 - Period 2: A Regulator of Multiple Tissue-Specific Circadian Functions
Other Figures
All Figure Page
Back to All Figure Page
FIGURE 10

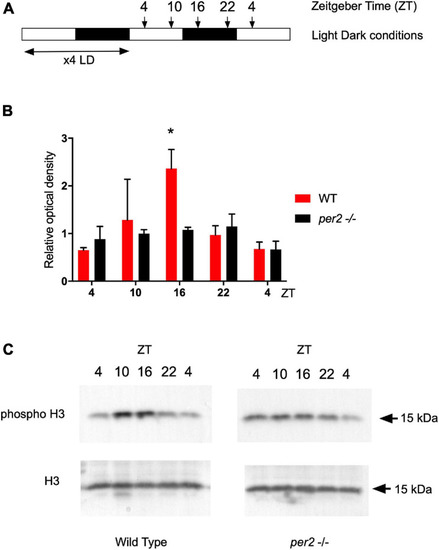
Western blot analysis and quantification of the phospho-H3 protein in fins of the WT and per2 KO zebrafish line. (A) Schematic representation of the experimental design. (B) Quantification of Western blot analysis of Phospho-Histone H3 (p-H3) ser10 expression level normalized to using Histone H3 (H3) as loading control. Relative optical density values for pH3-specific bands were calculated from measurements of ECL images and plotted on the y-axis. (C) Representative images of western blots obtained with pH3 and H3 specific antibodies used for the quantification in panel (B). Asterisks represent levels of significance in comparing the two genotypes at each timepoint individually, corrected by Sidak’s method (*p < 0.05).

Expression Data

Expression Detail
Antibody Labeling
Phenotype Data

Phenotype Detail
Acknowledgments
This image is the copyrighted work of the attributed author or publisher, and ZFIN has permission only to display this image to its users. Additional permissions should be obtained from the applicable author or publisher of the image. Full text @ Front. Mol. Neurosci.