IMAGE

FIGURE 3

ID
ZDB-IMAGE-210923-9
Genes
Source
Figures for Ruggiero et al., 2021
Image
Figure Caption

FIGURE 3

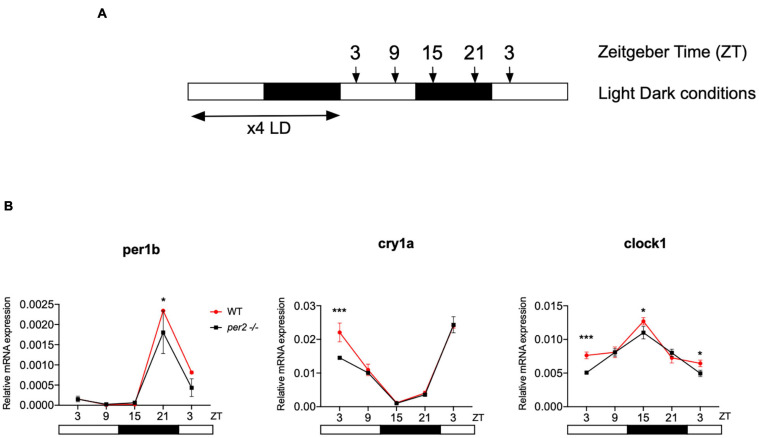
Circadian clock gene expression analysis in per2 KO and WT larvae. (A) Schematic representation of the experimental design. The horizontal bars represent the lighting conditions before and during sampling; white and black boxes indicate light and dark periods, respectively; the arrows show the sampling times. WT and per2 mutant larvae were kept 4 dpf in LD cycle (12 h light-12 h dark) conditions. On the 5th dpf, total RNA was extracted from pools of larvae collected at 6-h intervals during a sampling window of 24 h. (B) qRT-PCR analysis of mRNA expression levels of the circadian clock genes (clock1, cry1a, and per1b) in WT and per2 mutant larvae. Mean mRNA relative expression (n = 2–3) ± SD is plotted on the y-axis, while zeitgeber time (ZT) is plotted on the x-axis. ZT0 corresponds to lights-on, ZT12 to lights-off. A significant, small decrease in expression level was observed in mutants in all three genes (***p < 0.001, ANOVA genotype effect, Table 1). Asterisks represent levels of significance in comparing the two genotypes at each time point individually, corrected by Sidak’s method (***p < 0.001, *p < 0.05).

Figure Data
Acknowledgments
This image is the copyrighted work of the attributed author or publisher, and ZFIN has permission only to display this image to its users. Additional permissions should be obtained from the applicable author or publisher of the image. Full text @ Front. Mol. Neurosci.