|
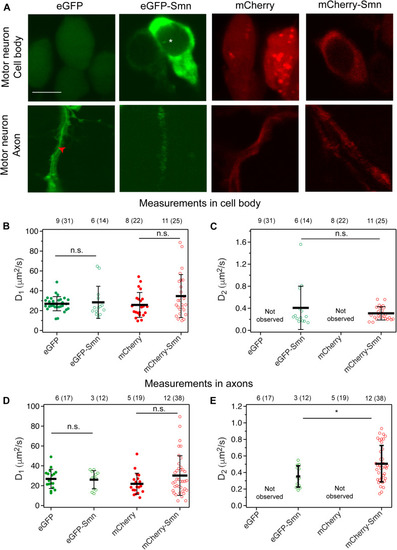
Expression and diffusion coefficients of FPs and FP-tagged Smn in zebrafish motor neurons. (A) Expression of eGFP, eGFP-Smn, mCherry, and mCherry-Smn in cell body and axon of motor neurons at 2 dpf. Images of cell body and axon are taken from different motor neurons. Scale bar = 5 μm. Red arrow indicates representative position where FCS measurement was taken in axon. (B) Average diffusion coefficients, D1 (μm2/s) of eGFP, eGFP-Smn, mCherry, mCherry-Smn in cell body. (C) Average diffusion coefficients, D2 (μm2/s) of eGFP-Smn, mCherry-Smn in cell body. (D) Average diffusion coefficients, D1 (μm2/s) of eGFP, eGFP-Smn, mCherry, mCherry-Smn in axons. (E) Average diffusion coefficients, D2 (μm2/s) of eGFP-Smn, mCherry-Smn in axons. Error bars represent the SD. (n.s.P > 0.05, *P < 0.05). The numbers above the graph indicate the numbers of fish (number of points) the measurements were taken in.
|