FIGURE

FIGURE 1

ID
ZDB-FIG-210902-21
Publication
Koh et al., 2021 - Fluorescence Correlation Spectroscopy Reveals Survival Motor Neuron Oligomerization but No Active Transport in Motor Axons of a Zebrafish Model for Spinal Muscular Atrophy
Other Figures
All Figure Page
Back to All Figure Page
FIGURE 1

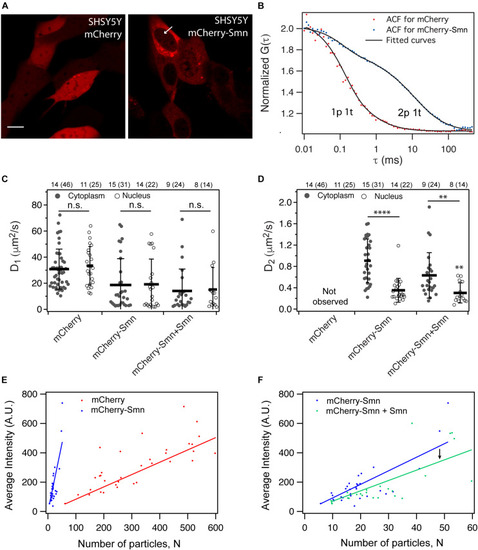
Expression and dynamics of mCherry and mCherry-Smn in SH-SY5Y cell culture. (A) Expression of mCherry and mCherry-Smn in SH-SY5Y cells 2 days after transfection. Scale bar = 10 μm. (B) Representative autocorrelation function (ACF) and fitted ACFs of mCherry and mCherry-Smn in the cytoplasm. ACF for mCherry is fitted to 3D 1p1t while ACF for mCherry-Smn is fitted to 3D 2p1t diffusion model. (C) Mean diffusion coefficients, D1 (μm2/s) in cytoplasm and nucleus for mCherry, mCherry-Smn and mCherry-Smn: Smn (mCherry-Smn co-transfected with untagged Smn). (D) Mean diffusion coefficients, D2 (μm2/s) in cytoplasm and nucleus. Error bars represent the SD. (∗∗P < 0.01, ****P < 0.0001). (E) Brightness analysis of mCherry and mCherry-Smn in cytoplasm by plotting average intensity vs. number of particles. mCherry-Smn particles are brighter than mCherry. (F) Brightness analysis of mCherry-Smn vs. mCherry-Smn with untagged Smn in the cytoplasm. With presence of untagged Smn, brightness of mCherry-Smn goes down. The numbers above the graphs indicate the number of cells (number of points) the measurements were taken in.

Expression Data

Expression Detail
Antibody Labeling
Phenotype Data

Phenotype Detail
Acknowledgments
This image is the copyrighted work of the attributed author or publisher, and ZFIN has permission only to display this image to its users. Additional permissions should be obtained from the applicable author or publisher of the image. Full text @ Front Cell Dev Biol