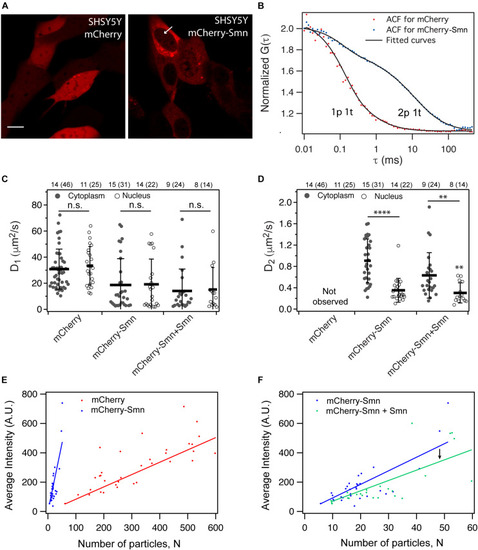
Expression and dynamics of mCherry and mCherry-Smn in SH-SY5Y cell culture. (A) Expression of mCherry and mCherry-Smn in SH-SY5Y cells 2 days after transfection. Scale bar = 10 μm. (B) Representative autocorrelation function (ACF) and fitted ACFs of mCherry and mCherry-Smn in the cytoplasm. ACF for mCherry is fitted to 3D 1p1t while ACF for mCherry-Smn is fitted to 3D 2p1t diffusion model. (C) Mean diffusion coefficients, D1 (μm2/s) in cytoplasm and nucleus for mCherry, mCherry-Smn and mCherry-Smn: Smn (mCherry-Smn co-transfected with untagged Smn). (D) Mean diffusion coefficients, D2 (μm2/s) in cytoplasm and nucleus. Error bars represent the SD. (∗∗P < 0.01, ****P < 0.0001). (E) Brightness analysis of mCherry and mCherry-Smn in cytoplasm by plotting average intensity vs. number of particles. mCherry-Smn particles are brighter than mCherry. (F) Brightness analysis of mCherry-Smn vs. mCherry-Smn with untagged Smn in the cytoplasm. With presence of untagged Smn, brightness of mCherry-Smn goes down. The numbers above the graphs indicate the number of cells (number of points) the measurements were taken in.

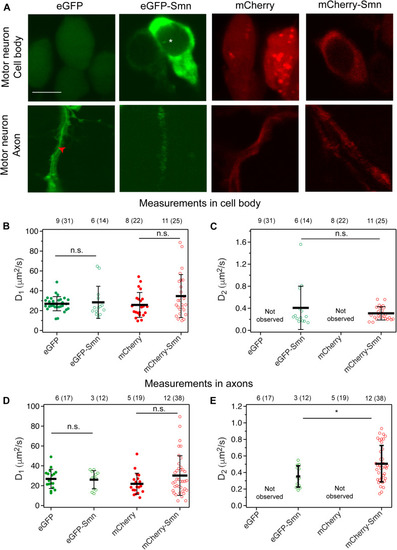
Expression and diffusion coefficients of FPs and FP-tagged Smn in zebrafish motor neurons. (A) Expression of eGFP, eGFP-Smn, mCherry, and mCherry-Smn in cell body and axon of motor neurons at 2 dpf. Images of cell body and axon are taken from different motor neurons. Scale bar = 5 μm. Red arrow indicates representative position where FCS measurement was taken in axon. (B) Average diffusion coefficients, D1 (μm2/s) of eGFP, eGFP-Smn, mCherry, mCherry-Smn in cell body. (C) Average diffusion coefficients, D2 (μm2/s) of eGFP-Smn, mCherry-Smn in cell body. (D) Average diffusion coefficients, D1 (μm2/s) of eGFP, eGFP-Smn, mCherry, mCherry-Smn in axons. (E) Average diffusion coefficients, D2 (μm2/s) of eGFP-Smn, mCherry-Smn in axons. Error bars represent the SD. (n.s.P > 0.05, *P < 0.05). The numbers above the graph indicate the numbers of fish (number of points) the measurements were taken in.

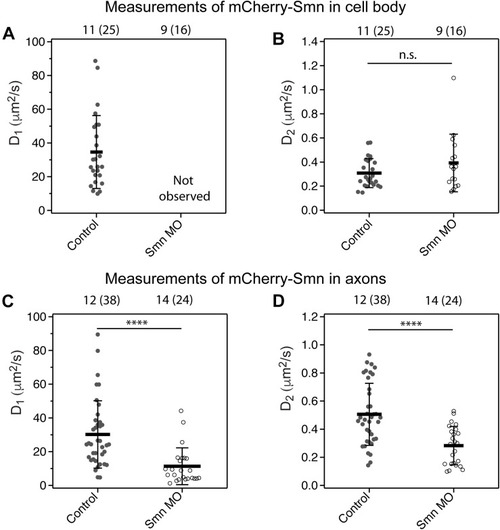
Diffusion coefficient of mCherry-Smn in motor neurons under smn MO conditions. (A,B) Average diffusion coefficients, D1, D2 (μm2/s) of mCherry-Smn in motor neuron cell bodies under uninjected control and smn MO conditions. D1 was not observed for mCherry-Smn under smn MO conditions. (C,D) Average diffusion coefficients, D1, D2 (μm2/s) of mCherry-Smn in axons for uninjected control and smn MO conditions. Error bars represent the SD. (n.s.P > 0.05, ****P < 0.0001). The numbers above the graph indicate the number of fish (number of points) the measurements were taken in.

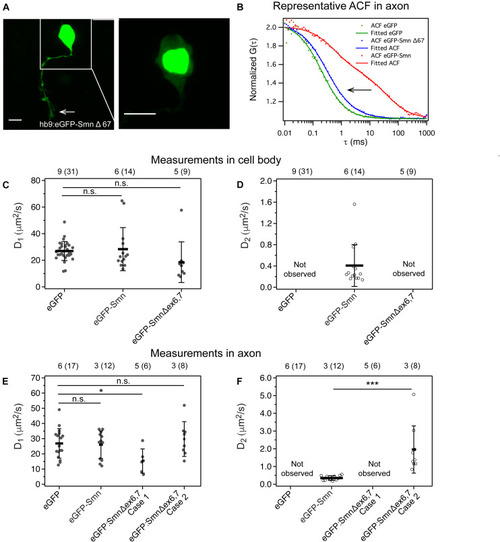
Expression and dynamics of eGFP- Smn Δex6,7 in zebrafish motor neurons. (A) Expression of eGFP- SmnΔex6,7 in motor neuron cell body and axon at 2 dpf. It is expressed strongly in the nucleus and weakly in axon and cytoplasm of cell body. (B) Representative ACF and fitted ACF of eGFP, eGFP-Smn and eGFP-SmnΔex6,7. (C) Average diffusion coefficients, D1 (μm2/s) of eGFP, eGFP-Smn, eGFP-SmnΔex6,7 in cell body. (D) Average diffusion coefficients, D2 (μm2/s) of eGFP-Smn, eGFP-SmnΔex6,7 in cell body. (E) Average diffusion coefficients, D1 (μm2/s) of eGFP, eGFP-Smn, eGFP- SmnΔex6,7 in axons. (F) Average diffusion coefficients, D2 (μm2/s) of eGFP-Smn, eGFP-SmnΔex6,7 in axons. Error bars represent the SD. (n.s.P > 0.05, P < 0.05, ∗∗∗P < 0.001). Measurements grouped under Case 1 were fitted to 3D 1-particle diffusion model, found in 6 out of 14 measurements, indicating a loss of the second component. Case 2 refers to measurements fitted to 3D 2-particle diffusion model, found in 8 out of 14 measurements. The numbers above the graph indicate the numbers of fish (number of points) the measurements were taken in.

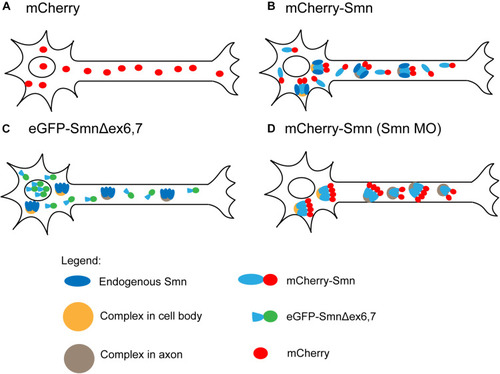
Summary of FCS observations. (A) Freely diffusing mCherry. (B) Two components of freely diffusing mCherry-Smn and mCherry-Smn with endogenous Smn in complexes that are distinct for cell body and axon (oligomers of mCherry-Smn and Smn are indicated by tetramers). (C) Truncated eGFP-Smn concentrates in nucleus, freely diffuses in cytoplasm. Complexes consist of only endogenous Smn. (D) Depletion of endogenous Smn led to a depletion of freely diffusing mCherry-Smn and mCherry-Smn replacing endogenous Smn in complexes. For details, see main text.

Acknowledgments
This image is the copyrighted work of the attributed author or publisher, and ZFIN has permission only to display this image to its users. Additional permissions should be obtained from the applicable author or publisher of the image. Full text @ Front Cell Dev Biol