|
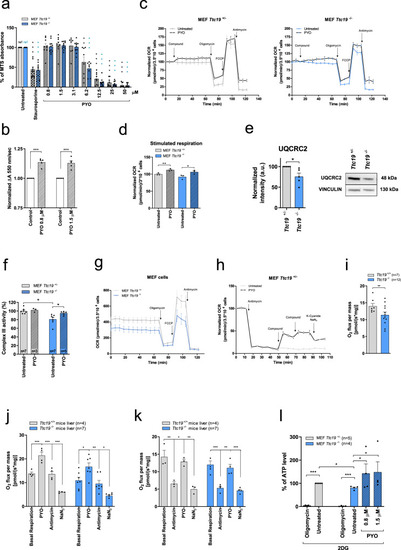
Sublethal concentrations of PYO rescue ATP production and cell respiration in <italic>Ttc19</italic><sup>−/−</sup> MEFs.a Viability of Ttc19+/− and Ttc19−/− MEFs, assessed by MTS assay after 24 h with no (refs.) or increasing doses of PYO, using 4 μM staurosporine (ST) as control. Values are means of A490 ± SEM (n = 9 assays). b Cyt c reduction as ΔA550 in isolated mitochondria, with rotenone (2 μM), antimycin A (2 μg/ml), and NaN3 (2.5 mM). PYO was added with 75 µM of reduced decylubiquinol. PYO-associated cyt c reduction was normalized to that of untreated mitochondria (n = 5 measurements, three independent mitochondria preparations, mean values ± SEM). c Oxygen consumption rate (OCR) of Ttc19+/− and Ttc19−/− MEF was measured in three biological replicas with 1.5 μM PYO. Values (means ± SEM) were normalized against those recorded before PYO. d OCR was recorded after sequential addition of oligomycin (2 μg/ml); FCCP (600 nM); antimycin A (1 μM). Results are means ± SEM normalized to untreated sample (n = 3 independent assays). e Expression level of CIII subunit UQCRC2 by Western blotting (five biological replicas). Vinculin was used as a loading control. f CIII activities in mitochondria from Ttc19+/− and Ttc19−/− MEFs, before and after the addition of PYO, normalized to citrate synthase (means ± SEM). g OCR in the same cells measuring their basal respiratory capacity (means ± SEM, n = 8 independent assays). h PYO restores respiration of Ttc19+/− MEF after CIII inhibition by antimycin A. Values were normalized with respect to basal respiration recorded before antimycin A addition (considered as 100%) (means ± SEM; n = 4 biological replicas). i–k OCR levels in the liver from Ttc19+/+ and Ttc19−/− mice. i shows basal respiration rate. PYO-dependent OCR was measured under basal condition. The sequence of additions was as shown, left to right. (means ± SEM). l Mitochondrial ATP content in Ttc19+/− and Ttc19−/− MEFs after treatment with PYO, using oligomycin as control. The same number of cells were grown in 5.5 mM glycolysis inhibitor 2-deoxyglucose (2-DG). Values are means of percentages of luciferase signals of treated vs untreated Ttc19+/− MEFs, ±SEM. One-way ANOVA with Dunnett’s multiple comparison test or two-tailed Student’s t test (*p < 0.05; **p < 0.01; ***p < 0.001).
|