IMAGE

Fig. 1

ID
ZDB-IMAGE-210503-23
Source
Figures for Peruzzo et al., 2021
Image
Figure Caption

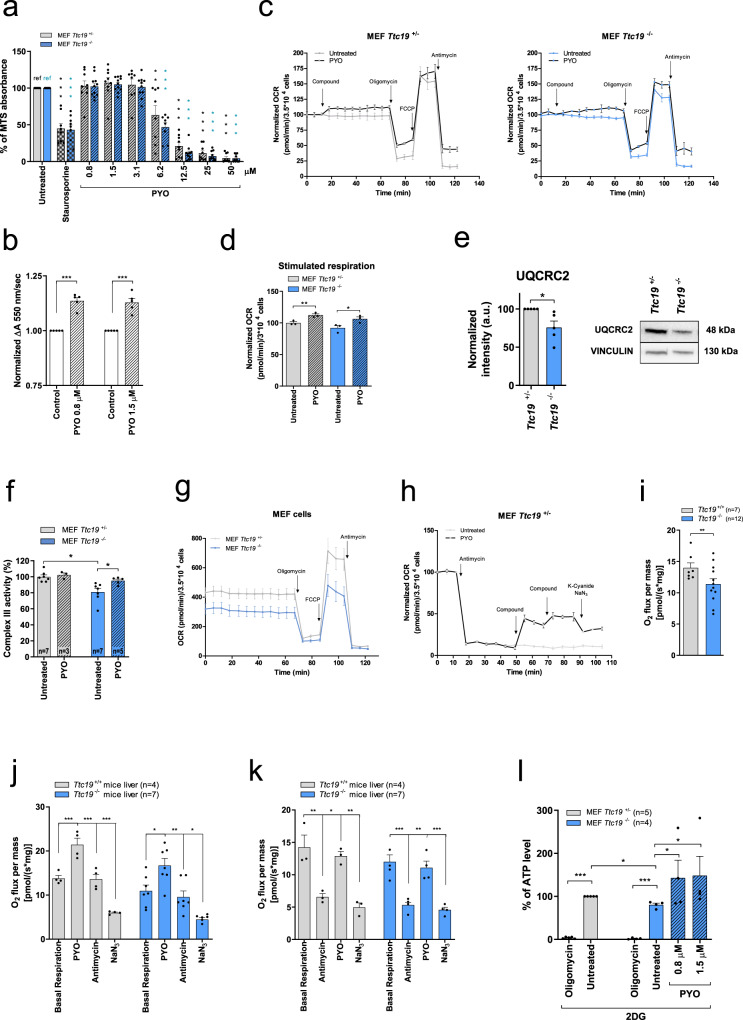
Fig. 1 Sublethal concentrations of PYO rescue ATP production and cell respiration in <italic>Ttc19</italic><sup>−/−</sup> MEFs.

a Viability of Ttc19+/− and Ttc19−/− MEFs, assessed by MTS assay after 24 h with no (refs.) or increasing doses of PYO, using 4 μM staurosporine (ST) as control. Values are means of A490 ± SEM (n = 9 assays). b Cyt c reduction as ΔA550 in isolated mitochondria, with rotenone (2 μM), antimycin A (2 μg/ml), and NaN3 (2.5 mM). PYO was added with 75 µM of reduced decylubiquinol. PYO-associated cyt c reduction was normalized to that of untreated mitochondria (n = 5 measurements, three independent mitochondria preparations, mean values ± SEM). c Oxygen consumption rate (OCR) of Ttc19+/− and Ttc19−/− MEF was measured in three biological replicas with 1.5 μM PYO. Values (means ± SEM) were normalized against those recorded before PYO. d OCR was recorded after sequential addition of oligomycin (2 μg/ml); FCCP (600 nM); antimycin A (1 μM). Results are means ± SEM normalized to untreated sample (n = 3 independent assays). e Expression level of CIII subunit UQCRC2 by Western blotting (five biological replicas). Vinculin was used as a loading control. f CIII activities in mitochondria from Ttc19+/− and Ttc19−/− MEFs, before and after the addition of PYO, normalized to citrate synthase (means ± SEM). g OCR in the same cells measuring their basal respiratory capacity (means ± SEM, n = 8 independent assays). h PYO restores respiration of Ttc19+/− MEF after CIII inhibition by antimycin A. Values were normalized with respect to basal respiration recorded before antimycin A addition (considered as 100%) (means ± SEM; n = 4 biological replicas). ik OCR levels in the liver from Ttc19+/+ and Ttc19−/− mice. i shows basal respiration rate. PYO-dependent OCR was measured under basal condition. The sequence of additions was as shown, left to right. (means ± SEM). l Mitochondrial ATP content in Ttc19+/− and Ttc19−/− MEFs after treatment with PYO, using oligomycin as control. The same number of cells were grown in 5.5 mM glycolysis inhibitor 2-deoxyglucose (2-DG). Values are means of percentages of luciferase signals of treated vs untreated Ttc19+/− MEFs, ±SEM. One-way ANOVA with Dunnett’s multiple comparison test or two-tailed Student’s t test (*p < 0.05; **p < 0.01; ***p < 0.001).

Acknowledgments
This image is the copyrighted work of the attributed author or publisher, and ZFIN has permission only to display this image to its users. Additional permissions should be obtained from the applicable author or publisher of the image. Full text @ Nat. Commun.