FIGURE SUMMARY
Title

Exploiting pyocyanin to treat mitochondrial disease due to respiratory complex III dysfunction

Authors
Peruzzo, R., Corrà, S., Costa, R., Brischigliaro, M., Varanita, T., Biasutto, L., Rampazzo, C., Ghezzi, D., Leanza, L., Zoratti, M., Zeviani, M., De Pittà, C., Viscomi, C., Costa, R., Szabò, I.
Source
Full text @ Nat. Commun.

Sublethal concentrations of PYO rescue ATP production and cell respiration in <italic>Ttc19</italic><sup>−/−</sup> MEFs.

a Viability of Ttc19+/− and Ttc19−/− MEFs, assessed by MTS assay after 24 h with no (refs.) or increasing doses of PYO, using 4 μM staurosporine (ST) as control. Values are means of A490 ± SEM (n = 9 assays). b Cyt c reduction as ΔA550 in isolated mitochondria, with rotenone (2 μM), antimycin A (2 μg/ml), and NaN3 (2.5 mM). PYO was added with 75 µM of reduced decylubiquinol. PYO-associated cyt c reduction was normalized to that of untreated mitochondria (n = 5 measurements, three independent mitochondria preparations, mean values ± SEM). c Oxygen consumption rate (OCR) of Ttc19+/− and Ttc19−/− MEF was measured in three biological replicas with 1.5 μM PYO. Values (means ± SEM) were normalized against those recorded before PYO. d OCR was recorded after sequential addition of oligomycin (2 μg/ml); FCCP (600 nM); antimycin A (1 μM). Results are means ± SEM normalized to untreated sample (n = 3 independent assays). e Expression level of CIII subunit UQCRC2 by Western blotting (five biological replicas). Vinculin was used as a loading control. f CIII activities in mitochondria from Ttc19+/− and Ttc19−/− MEFs, before and after the addition of PYO, normalized to citrate synthase (means ± SEM). g OCR in the same cells measuring their basal respiratory capacity (means ± SEM, n = 8 independent assays). h PYO restores respiration of Ttc19+/− MEF after CIII inhibition by antimycin A. Values were normalized with respect to basal respiration recorded before antimycin A addition (considered as 100%) (means ± SEM; n = 4 biological replicas). ik OCR levels in the liver from Ttc19+/+ and Ttc19−/− mice. i shows basal respiration rate. PYO-dependent OCR was measured under basal condition. The sequence of additions was as shown, left to right. (means ± SEM). l Mitochondrial ATP content in Ttc19+/− and Ttc19−/− MEFs after treatment with PYO, using oligomycin as control. The same number of cells were grown in 5.5 mM glycolysis inhibitor 2-deoxyglucose (2-DG). Values are means of percentages of luciferase signals of treated vs untreated Ttc19+/− MEFs, ±SEM. One-way ANOVA with Dunnett’s multiple comparison test or two-tailed Student’s t test (*p < 0.05; **p < 0.01; ***p < 0.001).

Sublethal concentrations of PYO are not toxic in vitro.

a Mitochondrial ROS production by Ttc19+/− and Ttc19−/− MEFs measured by Mitosox fluorescence. Cells were either left untreated or treated with 1.5 μM PYO, and then fluorescence was monitored for 1 h. Antimycin A and rotenone were used as a positive control. Values are percentages against measurements before additions (means ± SEM, n = 4 independent replicas). b, c Quantification of lipid peroxidation in Ttc19+/− and Ttc19−/− MEFs untreated and treated with 1.5 μM PYO for 72 h (b) or for 2 months (c). Positive control: cumene hydroperoxide (CH). Data are means ± SEM. The number of the quantified images over three independent experiments is reported in the histogram . d Quantification of protein oxidation in Ttc19+/− and Ttc19−/− MEFs, both untreated and treated with 1.5 μM PYO for 72 h (means ± SEM, n = 3 independent experiments). e Representative oxyblot and quantification of protein oxidation level of Ttc19+/− and Ttc19−/− MEFs untreated and treated with 1.5 μM PYO for 2 months (means ± SEM, n = 4 independent experiments). f Representative Western blot and quantification of catalase expression in Ttc19+/− and Ttc19−/− MEF lysates untreated or treated with 1.5 μM PYO for 2 months (means ± SEM, n = 4 independent experiments). g Mitochondrial membrane potential of Ttc19−/− MEF determined by monitoring the intensity of TMRM confocal fluorescence. Scale bar: 25 μm. Positive control: FCCP-treated cells. Images are representative of two experiments. h Mitochondrial membrane potential of Ttc19+/− and Ttc19−/− MEFs by monitoring the intensity of TMRM fluorescence after 1.5 μM PYO. Values are percentages of the basal TMRM fluorescence recorded before treatments (means ± SEM, n = 10 independent experiments). i Membrane potential was measured as in (h), PYO was added 10 min after the mix of the indicated substances. The concentrations of cyanide, oligomycin, atractyloside, and rotenone were 1 mM, 0.5 μg/ml, 20 μM, and 1 μM, respectively. Data are percentages of the basal TMRM fluorescence recorded before treatments and are means ± SEM of independent experiments. Two-way ANOVA with Bonferroni post test, or one-way ANOVA with Dunnett’s multiple comparison test, or two-tailed Student’s t test were used (*p < 0.05; **p < 0.01; ***p < 0.001).

PYO improves mitochondrial morphology in <italic>Ttc19</italic> KO mouse embryonic fibroblasts.

a Representative transmission electron microscopy images of MEF Ttc19+/− and MEF Ttc19−/− left untreated or treated for 72 h with 1.5 μM PYO. The average mitochondrial cross-sectional area was calculated for each condition using the ImageJ software. Quantification is shown (means ± SEM, n of the counted mitochondria is reported in the image). Scale bars: 500 nm. b, c Protein levels of Mitofusin-2 (b, n = 6 independent experiments), ATP5A (c, the value of n is reported in the figure), were assessed by Western blot. MEF Ttc19+/− and MEF Ttc19−/− were left untreated or treated for 24, 48, or 72 h with 1.5 μM PYO. Quantification by densitometry (means ± SEM) from independent experiments is reported in the upper part of the panels, while representative blots are presented in the lower parts. Na+K+ ATPase or β-actin were used as loading controls. d. Real-time PCR analysis of the transcription of Pgc-1α was assessed in MEF 9Ttc19+/− and MEF Ttc19−/− either left untreated or treated with 1.5 μM PYO for 48 or 72 h. All values were normalized on β-actin expression. The values are reported as means of percentages of RNA expression ± SEM (n = 3 independent replicas) with reference to the untreated Ttc19+/− sample, as indicated in the figure. e, f as in (b, c) using antibodies against PGC-1α (e, value of n is reported in the image) and TOM20 (f, n = 5 technical replicates over three biologically independent samples). Vinculin or Na+K+ ATPase were used as loading controls. Data are shown as means ± SEM. g One hundred nanomoles of PYO enhances Wnt signaling in MEF Ttc19+/− and MEF Ttc19−/− cells incubated with PYO for the indicated times (means ± SEM, n = 7 technical replicates over three biological independent samples). h PYO significantly increases Wnt signaling in a zebrafish reporter line following incubation of the embryos with nonlethal 100 nM concentration for 24 h (n = 31 embryos for each condition). Scale bars: 1 mm. Statistical significance (one-way ANOVA with Dunnett’s multiple comparison test or two-tailed Student’s t test) was calculated for all panels (*p < 0.05; **p < 0.01; ***p < 0.001).

PYO increases respiration and ATP production, and recovers mitochondrial morphology in human fibroblasts from patients with <italic>TTC19</italic> gene mutations.

a MTS assays were performed on human healthy fibroblasts (n = 3 independent assays) and fibroblasts from a patient harboring a homozygous pathogenic mutation in the TTC19 gene (fibroblasts pt#1) (n = 4 independent assays). Cells were either left untreated or treated with different dosages of PYO for 24 h to determine the highest concentration of PYO that did not affect cell survival. Positive control: 4 μM staurosporine. Data are percentages (means ± SEM) of MTS absorbance at 490 nm vs untreated sample (ref.). b, c Mitochondrial ATP content in human healthy fibroblasts and patients’ fibroblasts after treatment with PYO. Oligomycin was used as a control. Cells were treated for 1 h in a fresh medium, in which glucose had been replaced with 5.5 mM 2-DG to inhibit glycolysis. In b, values are reported as the percentage of luciferase signal vs. untreated sample (ref). In c, values are percentage of luciferase signal with reference to the untreated human healthy fibroblasts (in gray). Values are means ± SEM of independent experiments. d, e OCR was measured in human healthy fibroblasts and patient #1 fibroblasts (d) in the presence or absence of 0.8 μM PYO. Values were normalized to basal respiration before PYO (means ± SEM, n = 4 independent experiments). Bioenergetic parameters were calculated after sequential addition of oligomycin (2 μg/ml); FCCP (600 nM); antimycin A (1 μM). Stimulated respiration is reported in (e). Values are means ± SEM against untreated sample (n = 4 independent experiments). f OCR was measured in human healthy fibroblasts to assess the capability of PYO to restore cell respiration after antimycin A inhibition of CIII. Values were normalized vs. basal respiration recorded before antimycin A (means ± SEM, n = 3 independent experiments). g Mitochondrial membrane potential of human healthy fibroblasts and patient #1 fibroblasts was assessed monitoring the intensity of TMRM fluorescence after 0.8 μM PYO addition as in Fig. 2h (means ± SEM, n = 4 independent experiments). Two-way ANOVA with Bonferroni post test, or one-way ANOVA with Dunnett’s multiple comparison test, or two-tailed Student’s t test were determined (*p < 0.05; **p < 0.01; ***p < 0.001).

PYO recovers mitochondrial morphology in human fibroblasts from patients with <italic>TTC19</italic> gene mutations, with no oxidation toxicity.

a Representative transmission electron microscopy images of human healthy fibroblasts and fibroblasts from patient #1, untreated or treated for 72 h with 0.8 μM PYO. Sample preparation and images analysis were performed as in Fig. 3a. Quantification is shown (means ± SEM) and the number of mitochondria counted is reported in the histogram. Scale bar: 1 µm. b Mitochondrial ROS production by human healthy and by fibroblasts from patient #1 was determined by measuring the intensity of Mitosox fluorescence as in Fig. 2a. PYO was added at a final concentration of 0.8 μM. Values are means ± SEM (n = 4 independent experiments). c Representative oxyblot and the relative quantification of the protein oxidation level of healthy fibroblasts and patients’ samples, both untreated and treated with 0.8 μM PYO for 72 h (means ± SEM, n = 3 independent experiments). d Quantification of the lipid peroxidation in human healthy fibroblasts and fibroblasts from patients #1, #2, #3, untreated or treated for 72 h with 0.8 μM PYO. Cumene hydroperoxide (CH) was used as a positive control. Representative images are presented in Figure S3f (means ± SEM). The number of images quantified, recorded in three independent experiments, is reported. e Representative Western blot and the relative quantification of the catalase expression level in human healthy fibroblasts and fibroblasts from patients carrying TTC19 mutations, both untreated and treated with 0.8 μM PYO for 72 h (means ± SEM of independent experiments). Statistical significance (two-way ANOVA with Bonferroni post test or two-tailed Student’s t test) was determined for all panels (*p < 0.05; **p < 0.01; ***p < 0.001).

PYO-treated <italic>dTTC19</italic> KO flies.

a ATP in 5-day-old male flies (dTTC19 KO) and controls (w1118), after 12–24 h fasting (n = 3 × 10 individuals). Significant difference between KO and controls was at 24 h. Means ± SEM (two-tailed Student’s t test, **p < 0.01). b PYO toxicity assessed in WT flies (w1118) after 1.0–200 pmol PYO injection into the hemolymph of male flies. The % of surviving flies was recorded at 24, 48, and 72 h. Kaplan–Meier (p < 0.0001), with Bonferroni-corrected Mantel–Cox log-rank was: 1 pmol vs. 100–200 pmol: p < 0.001; 10 pmol vs. 100–200 pmol: p < 0.001; 50 pmol vs. 100–200 pmol: p < 0.01, p < 0.001 respectively). c ATP levels in 5-day-old control (w1118 and dTTC19 KO) and 1 pmol PYO (w1118 PYO and dTTC19 KO PYO) flies after 24 h fasting (n = 3 × 10 individuals). PYO increased ATP production in dTTC19 KO flies to that of w1118 control. Means ± SEM (two-tailed Student’s t test, **p < 0.01). d PYO partially recovered bang sensitivity in 5-day-old flies (dTTC19 KO PYO), vs. controls (w1118; w1118 injection control flies, and dTTC19 KO injection control flies). The % of flies reaching threshold distances (2.8, 5.6, 8.4, and 11.2 cm) is shown for the indicated genotypes, ±PYO injection. Means ± 95% CI (one-way ANOVA with post hoc on Tukey’s test: *p < 0.05; **p < 0.01; ***p < 0.001). e As in (d). Bang test in 12-day-old KO flies after 1 pmol PYO (dTTC19 KO PYO) vs. controls as above. The % of flies reaching the threshold distances are shown as above. Error bars mean 95% CI (one-way ANOVA with post hoc on Tukey’s test: *p < 0.05; **p < 0.01; ***p < 0.001). f Representative oxyblot and quantification of protein oxidation with 1 pmol PYO (w1118 PYO and dTTC19 KO PYO) and relative controls as above (n = 2 independent experiments). gPgc-1α expression assessed by qRT-PCR in w1118 and dTTC19 KO flies untreated or treated with 1 pmol PYO (n = 3 biological replicates). Means ± SEM (one-way ANOVA with post hoc on Tukey’s test, *p < 0.05). h Toxicity associated with double injections (1 pmol PYO solution, n = 58 individuals vs. control solution, n = 53 individuals) assessed in WT male flies w1118. The % of surviving flies was assessed at 24, 48, and 72 h after the second injection.

Characterization of <italic>TTC19</italic> KD zebrafish treated with PYO.

a, b OCR was analyzed in control morpholino (Ctrl MO), TTC19 KD (Ttc19 spMO), and 100 nM PYO-rescued Ttc19 spMO zebrafish. Respiratory capability of zebrafish (72 h post fertilization (hpf)) was analyzed by oxygraph technology. O2 consumption/fish is shown in graphs, including the best linear fit (quantified in b), reporting 180 s of a mean plot obtained from six independent experiments. Shown are data for Ctrl MO, Ttc19 spMO, and 100 nM PYO pre-treated Ttc19 spMO (n = 6 biological replicates with 15 randomly selected individuals for each replicate). SEM is reported as a dashed line for each group of fishes (a). Δ[pmolO2]/fish × min of treated fish are reported for Ctrl MO, TTC19 KD, and rescue, respectively (b). Statistical analysis was performed by the two-tailed Student’s t test. (*p < 0.05, **p < 0.01). Bars refer to SEM. c PYO dose–response survival assay was performed in embryos exposed to the indicated doses of the drug for 24 h. Vitality and positive reaction to evoked touch response (ETR) were assessed. d ETR assays were performed in 72 hpf zebrafish, to assess embryo movements by measuring the distance (cm) between the initial (center of the Petri dish) and the final position of the embryo measured as linear distance traveled starting from the center. Statistical analysis was performed by the two-tailed Student’s t test. (*p < 0.05, ***p < 0.001), means and medians are reported in the graph. The number of manipulated embryos is also reported. e Traces of movement of 40 individual fishes/Petri dish (circle) placed in the center of the dish and stimulated by touch. Fishes treated with 100 nM PYO (rightmost figure) were able to partially recover movement (see also Movie 1). fTTC19 KD induces body shortening and tail malformation in comparison to sibling controls. One hundred nanomoles of PYO was administered in the fish water at 12 hpf, partially rescuing body malformation and in part death (n = 6 biological replicates, the precise number of analyzed zebrafish for each phenotype is reported in the figure). Scale bars: 0.5 mm. Statistical analysis was performed by the two-tailed Student’s t test (*p < 0.05).

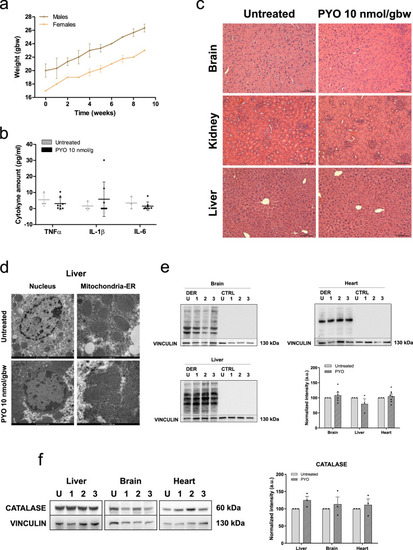
PYO showed no toxicity in vivo in wt mice.

a Effect of PYO (10 nmol/g) on mice body weight in 6-week-old WT C57Bl6/J males (n = 4) and C57Bl6/J females (n = 4). Weekly measurements of mice body weight (grams) are shown. Data are means ± SEM. b Plasma proinflammatory cytokine levels (TNF-α, IL-1β, IL-6) from mice treated with PYO 10 nmol/g (n = 8 independent samples) were not significantly altered compared to untreated controls (n = 3 independent samples). Bars indicate mean ± SEM with superimposed individual data points. c Representative light micrographs of the liver, kidney, and brain sections from mice untreated or treated with PYO (10 nmol/g) for 2 months (n = 3 biological replicates). All organs were free from gross pathological changes on hematoxylin and eosin (H&E) staining. Scale bar: 100 μm. d Representative TEM images of the liver sections from mice untreated or treated with 10 nmol/g PYO. Nucleus, mitochondria, ER, and the other detected organelles did not show any visible alterations (n = 3 biological replicates). Scale bars are reported in each picture. e Representative oxyblot of the liver, heart, and brain lysates from mice untreated (U) or treated (1, 2, and 3) with PYO (10 nmol/g) for 2 months. Samples were either derivatized by adding DNPH (2, 4-dinitrophenyl hydrazine) solution (DER) to visualize carbonyl groups introduced by oxidative modifications, or treated with derivatization-control solution (CTRL). Vinculin was used as a loading control (means ± SEM, n = 3 independent samples). f Representative Western Blot and the relative quantifications of catalase expression levels observed in lysates of liver, heart, and brain samples lysates from mice untreated (U) or treated (1, 2, and 3) with PYO (10 nmol/g) for 2 months. Vinculin was used as a loading control (means ± SEM, n = 3 independent samples). For all panels, statistical significance was calculated using two-tailed Student’s t test.

Acknowledgments
This image is the copyrighted work of the attributed author or publisher, and ZFIN has permission only to display this image to its users. Additional permissions should be obtained from the applicable author or publisher of the image. Full text @ Nat. Commun.