|
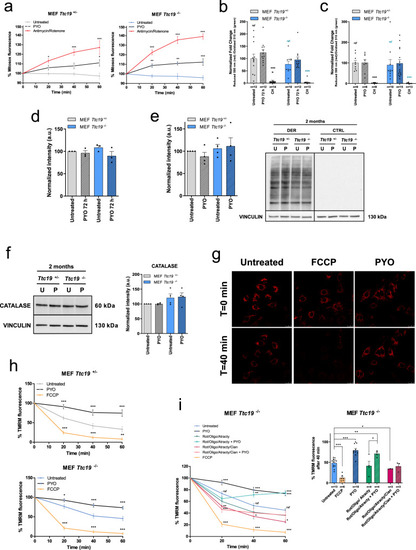
Sublethal concentrations of PYO are not toxic in vitro.a Mitochondrial ROS production by Ttc19+/− and Ttc19−/− MEFs measured by Mitosox fluorescence. Cells were either left untreated or treated with 1.5 μM PYO, and then fluorescence was monitored for 1 h. Antimycin A and rotenone were used as a positive control. Values are percentages against measurements before additions (means ± SEM, n = 4 independent replicas). b, c Quantification of lipid peroxidation in Ttc19+/− and Ttc19−/− MEFs untreated and treated with 1.5 μM PYO for 72 h (b) or for 2 months (c). Positive control: cumene hydroperoxide (CH). Data are means ± SEM. The number of the quantified images over three independent experiments is reported in the histogram . d Quantification of protein oxidation in Ttc19+/− and Ttc19−/− MEFs, both untreated and treated with 1.5 μM PYO for 72 h (means ± SEM, n = 3 independent experiments). e Representative oxyblot and quantification of protein oxidation level of Ttc19+/− and Ttc19−/− MEFs untreated and treated with 1.5 μM PYO for 2 months (means ± SEM, n = 4 independent experiments). f Representative Western blot and quantification of catalase expression in Ttc19+/− and Ttc19−/− MEF lysates untreated or treated with 1.5 μM PYO for 2 months (means ± SEM, n = 4 independent experiments). g Mitochondrial membrane potential of Ttc19−/− MEF determined by monitoring the intensity of TMRM confocal fluorescence. Scale bar: 25 μm. Positive control: FCCP-treated cells. Images are representative of two experiments. h Mitochondrial membrane potential of Ttc19+/− and Ttc19−/− MEFs by monitoring the intensity of TMRM fluorescence after 1.5 μM PYO. Values are percentages of the basal TMRM fluorescence recorded before treatments (means ± SEM, n = 10 independent experiments). i Membrane potential was measured as in (h), PYO was added 10 min after the mix of the indicated substances. The concentrations of cyanide, oligomycin, atractyloside, and rotenone were 1 mM, 0.5 μg/ml, 20 μM, and 1 μM, respectively. Data are percentages of the basal TMRM fluorescence recorded before treatments and are means ± SEM of independent experiments. Two-way ANOVA with Bonferroni post test, or one-way ANOVA with Dunnett’s multiple comparison test, or two-tailed Student’s t test were used (*p < 0.05; **p < 0.01; ***p < 0.001).
|