
Fig. 2
- ID
- ZDB-FIG-210413-22
- Publication
- Rességuier et al., 2021 - Biodistribution of surfactant-free poly(lactic-acid) nanoparticles and uptake by endothelial cells and phagocytes in zebrafish: Evidence for endothelium to macrophage transfer
- Other Figures
- All Figure Page
- Back to All Figure Page
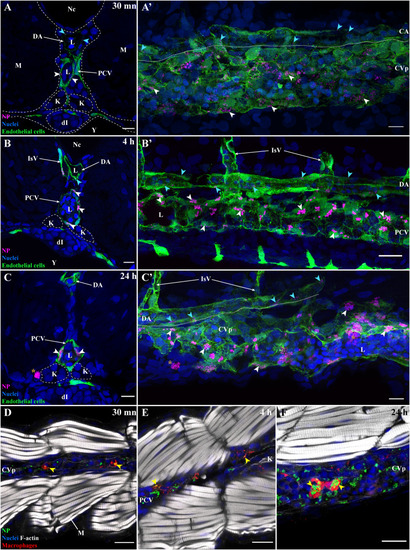
Dynamics of PLA-NP internalization by endothelial cells and macrophages at 30 min, 4 h and 24 h post-injection. Representative images of 3 dpf fli:GFP zebrafish transversally sectioned (A, B, C), para-sagitally sectioned (A',B′,C′) and of 3 dpf mpeg1:mCherry zebrafish para-coronally sectioned (D-F). Images were acquired from 30 μm thick whole-organism cryosections. Images (A-C′) highlight PLA-NP (magenta), endothelial cells (green) and nuclei (blue), while images (D-F) highlight PLA-NP (green), macrophages (red), F-actin (white) and nuclei (blue). (A,A') The internalization of NP by endothelial cells from both veins (white arrowheads) and artery (cyan arrowheads) was already evident 30 min post-administration while no free-circulating PLA-NP could be observed within the blood flow. From this timepoint, no further change in the distribution of PLA-NP among endothelial cells from vein (white arrowheads) and artery (cyan arrowheads) could be detected 4 h (B-B′) and 24 h (C-C′) later, apart from the aggregation of the PLA-NP overtime (A',B′,C′). Note the presence of large aggregates of PLA-NP within phagocytes outside the lumen at the 24 h timepoint (C-C′ – orange stars). Similar observations apply to the internalization of PLA-NP by macrophages with uptake (yellow arrowheads) observed 30 min (D), 4 h (E) and 24 h (F) post-administration. While only qualitative, observations of PLA-NP accumulation among macrophages suggested they were larger at 24 h (F) than at 30 min (D) post-administration. (A,B,C) 1 μm MIP (x60 objective). (A') 20 μm MIP (x60 objective). (B′) 13 μm MIP (x60 objective). (C′) 22 μm MIP (x60 objective). (D,E,F) single optical sections (x60 objectives). Annotations: CA, caudal artery; CVp, caudal vein plexus, DA, dorsal aorta; dI, developing intestines; K, kidney; L, IsV, intersegmental vessel, lumen; M, muscles, Nc, notochord; PCV, post-cardinal vein; Y, yolk. Scale bars: 20 μm (A',B′,E-F) and 10 μm (A,B,C-D). (For interpretation of the references to colour in this figure legend, the reader is referred to the web version of this article.) |