
- Title
-
Biodistribution of surfactant-free poly(lactic-acid) nanoparticles and uptake by endothelial cells and phagocytes in zebrafish: Evidence for endothelium to macrophage transfer
- Authors
- Rességuier, J., Levraud, J.P., Dal, N.K., Fenaroli, F., Primard, C., Wohlmann, J., Carron, G., Griffiths, G.W., Le Guellec, D., Verrier, B.
- Source
- Full text @ J. Control Release
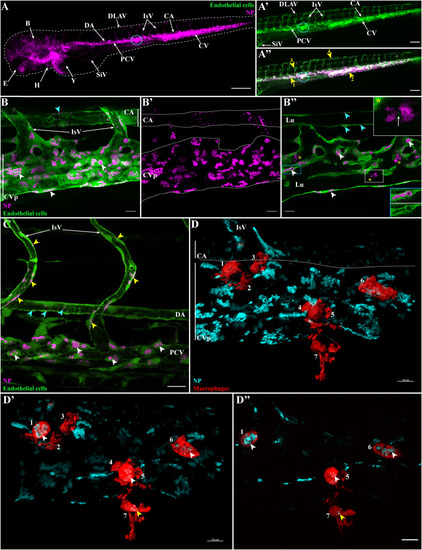
Internalization of PLA-NP by endothelial cells and macrophages. Representative live-acquisitions of 3 dpf zebrafish, 2 h after intravenous administration of PLA-NP, using a stereomicroscope (A-A") or a spinning-disk confocal microscope (B-D"). (A-A") Fluorescent PLA-NP (magenta) appear closely associated (yellow arrows) with the whole vasculature of fli:GFP+ fish (green). Injection sites are usually at the post-cardinal veins (blue circle) or within the inferior region of the caudal vein. As illustrated by the maximum intensity projection (MIP), which displays both PLA-NP and endothelial cells (B) and PLA-NP only (B′), strong accumulations of PLA-NP are observed within the endothelial cells of the caudal vein plexus (white arrowheads). PLA-NP are also taken-up by the endothelial cells of the caudal artery (cyan arrowheads). (B″) As revealed by optical sections (B), among both the caudal vein plexus and the caudal artery (white and cyan arrowheads, respectively), PLA-NP within endothelial cells are stored inside GFP negative cellular compartments. This localization is even more striking when the fluorescence signal from PLA-NP is removed (blue panel). Cluster of PLA-NP could be observed among luminal phagocytes (yellow stars). Co-internalization of GFP and PLA-NP within some luminal phagocytes has also been noticed (white arrow within white panel). (C) PLA-NP internalization is not restricted to the caudal vein plexus or the dorsal aspect of the post-cardinal vein. Endothelial cells from the whole post-cardinal vein (white arrowhead), the intersegmental vessels (yellow arrowhead) and the dorsal aorta (cyan arrowhead) are PLA-NP-positive, illustrating the pan-vascular internalization of PLA-NP. (D) From a mpeg1:mCherry zebrafish, MIP illustrating the presence of 7 macrophages (3D surface - red) close to PLA-NP (cyan) within the caudal vein plexus area. Both opening of the stack with a clipping plane (D') and the optic sections (D") reveal internalizations of PLA-NP by macrophage from the lumen (white arrowheads – 1, 5, 6) and outside the lumen (yellow arrowhead - 7). (B-B′) 17 μm MIP (x60 objective) from which (B″) is a 1 μm thick optical section. (C) 50 μm MIP (x60 objective). (D) 13 μm MIP (x60 objective) with a 3D surface reconstruction of the macrophage fluorescence signal. (D') illustrates an opening the MIP with a clipping plane, while (D") is a 1 μm thick optic section from the stack. Annotations: B, brain; CA, caudal artery; CVp, caudal vein plexus; DA, dorsal aorta; DLAV, dorsal longitudinal anastomotic vessel; E, eye; H, heart; IsV, intersegmental vessel; Lu, lumen; PCV, post-cardinal vein; SiV, sub-intestinal veins; Y, yolk. Scale bars: 200 μm (A), 100 μm (A'-A"), 20 μm (C) and 10 μm (B-B″, D-D"). (For interpretation of the references to colour in this figure legend, the reader is referred to the web version of this article.) |
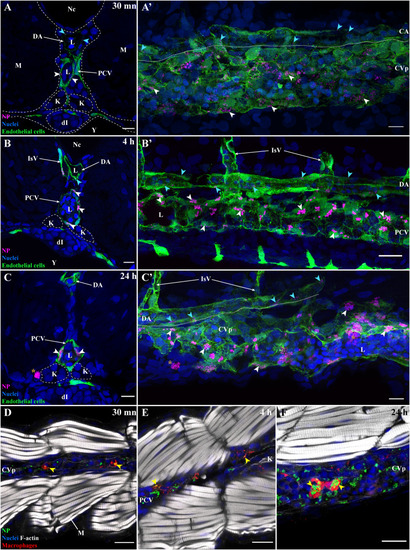
Dynamics of PLA-NP internalization by endothelial cells and macrophages at 30 min, 4 h and 24 h post-injection. Representative images of 3 dpf fli:GFP zebrafish transversally sectioned (A, B, C), para-sagitally sectioned (A',B′,C′) and of 3 dpf mpeg1:mCherry zebrafish para-coronally sectioned (D-F). Images were acquired from 30 μm thick whole-organism cryosections. Images (A-C′) highlight PLA-NP (magenta), endothelial cells (green) and nuclei (blue), while images (D-F) highlight PLA-NP (green), macrophages (red), F-actin (white) and nuclei (blue). (A,A') The internalization of NP by endothelial cells from both veins (white arrowheads) and artery (cyan arrowheads) was already evident 30 min post-administration while no free-circulating PLA-NP could be observed within the blood flow. From this timepoint, no further change in the distribution of PLA-NP among endothelial cells from vein (white arrowheads) and artery (cyan arrowheads) could be detected 4 h (B-B′) and 24 h (C-C′) later, apart from the aggregation of the PLA-NP overtime (A',B′,C′). Note the presence of large aggregates of PLA-NP within phagocytes outside the lumen at the 24 h timepoint (C-C′ – orange stars). Similar observations apply to the internalization of PLA-NP by macrophages with uptake (yellow arrowheads) observed 30 min (D), 4 h (E) and 24 h (F) post-administration. While only qualitative, observations of PLA-NP accumulation among macrophages suggested they were larger at 24 h (F) than at 30 min (D) post-administration. (A,B,C) 1 μm MIP (x60 objective). (A') 20 μm MIP (x60 objective). (B′) 13 μm MIP (x60 objective). (C′) 22 μm MIP (x60 objective). (D,E,F) single optical sections (x60 objectives). Annotations: CA, caudal artery; CVp, caudal vein plexus, DA, dorsal aorta; dI, developing intestines; K, kidney; L, IsV, intersegmental vessel, lumen; M, muscles, Nc, notochord; PCV, post-cardinal vein; Y, yolk. Scale bars: 20 μm (A',B′,E-F) and 10 μm (A,B,C-D). (For interpretation of the references to colour in this figure legend, the reader is referred to the web version of this article.) |
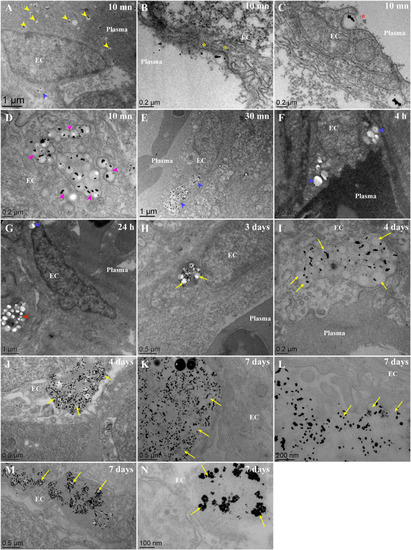
Fate of PLA-NP(Gold) once internalized by endothelial cells, from 10 min to 7 days post-injection, as observed with TEM. Representatives electron micrograph of ultrathin (60 nm) epon sections from zebrafish larvae injected at 3 dpf with PLA-NP encapsulating gold particles (<10 nm), 10 min (A-D), 30 min (E), 4 h (F), 24 h (G), 3 days (H), 4 days (I-J) and 7 days (K-N) post-injection. (A-D) 10 min following intravenous injection, PLA-NP are circulating within the bloodstream (A - yellow arrowhead) and internalized by endothelial cells (A - blue arrowhead). Internalization of PLA-NP by endothelial cells involve an invagination of the plasma membrane, resembling clathrin-mediated internalization (B - yellow stars), as well as figures resembling phagocytosis (C – red stars). Numerous NP were already being condensed within cellular compartment of some endothelial cells (D – magenta arrowheads). 30 min after the injection, no more PLA-NP could be observed within the bloodstream, in contrast to the massive concentration of PLA-NP within endothelial cells (E - blue arrowhead). No sign of degradation could be observed from PLA-NP internalized by endothelial cells (A, E-G - blue arrowhead) and underlying phagocytes (G - red arrowhead) during the first 24 h. Starting from 3 days post-injection, change in the colloidal stability of internalized PLA-NP was evident in some cells, encapsulated gold-particles being released from the NP-PLA matrix (H - yellow arrows). PLA-NP degradation was seemingly more pronounced 4 days post-injection, within some endothelial cells PLA-NP could are observed with a shrunken size (I - yellow arrows) while in others there are more gold crystals free rather than inside the PLA matrix (J - yellow arrows). Finally, a week after the injection different shade of PLA-NP degradation could be observed inside endothelial cells, cellular compartment filled with a paste of amorphous PLA containing gold crystals (K-L - yellow arrows), shrunken PLA-NP with released gold crystals (M - yellow arrows) and cellular compartment where only aggregated gold crystals remain (N - yellow arrows). Annotations: EC, endothelial cell. Scale bars: 1 μm (A,E,G), 500 nm (F,H,J-K,M), 200 nm (B-D,I,L) and 100 nm (N). (For interpretation of the references to colour in this figure legend, the reader is referred to the web version of this article.) |
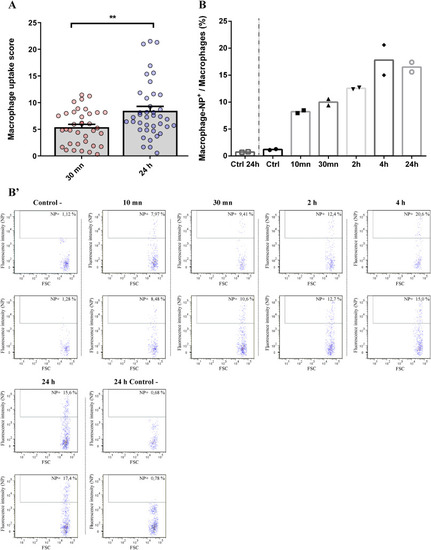
Quantitative analysis of PLA-NP internalization by macrophage from 10 min to 24 h post-injection. (A) Automated analysis of the relative amount of internalized fluorescent PLA-NP by macrophage 10 min and 24 h following intravenous injection of 3 dpf mpeg1:mCherry zebrafish. Stereo-microscope acquisitions of individual zebrafish were put through an ImageJ macro, from which an internalization score was calculated, based on the amount of red PLA-NP fluorescence associating with the green macrophage fluorescence signal, relative to the total amount of red PLA-NP fluorescence detected from the whole fish. Histograms represent the mean internalization score and each dot represents the score of an individual zebrafish. From 30 min to 24 h post-injection, more NP were internalized by macrophages (+56%). (B) Flow cytometry analysis of the fraction of macrophages that had internalized fluorescent PLA-NP relative to the whole population of macrophages, 10 min to 24 h after intravenous injection into 3 dpf zebrafish. Histograms represent the mean percentage of PLA-NP positive macrophages at different time-points following administration, with each dot representing the data acquired from 10 pooled larvae. Almost 8% of macrophages were labelled positive for PLA-NP 10 min after the injection. After this time, the fraction of macrophage internalizing PLA-NP steadily increased over time until it reached a plateau around 17% of PLA-NP-positive macrophages at 4 h and 24 h post-injection. All the flow-cytometry acquisitions are illustrated in (B′), they only display the population of macrophage which was gated based on the mCherry fluorescence intensity. The x axis displays the “size” of the detected events and the y axis the fluorescence intensity corresponding to PLA-NP. Error bars: SEM. Significance level is indicated as: **p < .01. Number of fish per condition: (A) 30 min (36) and 24 h (40); (B) 10 larvae per replicate. (For interpretation of the references to colour in this figure legend, the reader is referred to the web version of this article.) |
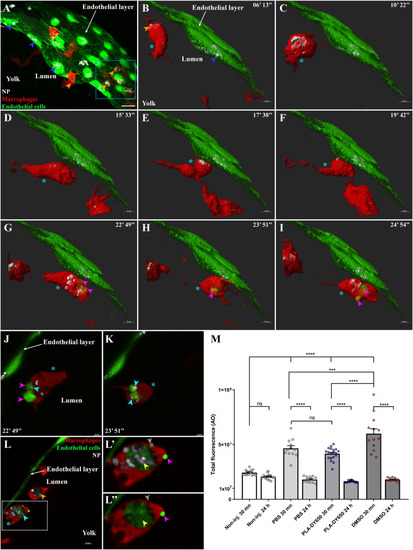
Transfer of PLA-NP from endothelial cells to macrophages. Representative live-acquisitions of 3 dpf mpeg1:mCherry and fli:GFP double transgenic zebrafish, 30 min after the intravenous injection of far-red fluorescent PLA-NP and using a spinning-disk confocal microscope. The acquisitions were made at the yolk circulation valley as illustrated in (A – 53 μm MIP, x63 objective), endothelial cells and macrophages being represented as a 3D surface reconstruction (green and red, respectively) and where PLA-NP (white) internalized by endothelial cells (blue arrowheads) and macrophage (orange arrowheads) can be observed. (B-I) The video (14 μm MIP), made across PLA-NP+ endothelial cells (blue arrowhead) of the endothelial layer covering the yolk, focuses on a macrophage (cyan star) which is already PLA-NP+ (orange arrowheads). At first, the macrophage enters in the proximity of the PLA-NP-positive endothelial cells (B-D). After almost 10 min at this position (E-F), GFP-labelled fragments of endothelial cell can be observed within the macrophage (G-I - magenta arrowheads) while the endothelial cells remain alive (J-K). Optical sections (1 μm) from G and H respectively, indicate the presence of PLA-NP (cyan arrowheads) inside the GFP-labelled fragment of endothelial cells (magenta arrowheads) that have been transferred to the macrophage (cyan star). (L) On an acquisition few minutes after the video, PLA-NP can be seen inside a GFP-negative macrophage (orange arrowhead), and within the GFP+ macrophage (cyan star and arrowhead). (L'-L") A close-up of the latter macrophage shows the presence of GFP-/PLA-NP+ cellular compartment (grey arrowhead), along with a massive GFP+/PLA-NP+ one in which both PLA-NP and the GFP+ cytosolic fragments of the endothelial cell co-localize (yellow arrowhead). Note the presence of a bright GFP+ structure at the surface of the macrophage (magenta arrowhead). (M) Analysis of the cell death following PLA-NP injection, assessed by the overall acridine orange fluorescence intensity (y-axis) of the whole zebrafish by stereomicroscopy. Intravenous injection of PLA-NP (DY650) does not induce cell death other than the mechanical injury from the injection, which is healed by 24 h post-injection. Each dot represents one single individual. Error bars: SEM. Significance level is indicated as: ***p < .001 and ****p < 0,0001. Number of fish per condition (30 min / 24 h): Non-injected (14 / 15), PBS-injected (12 / 12), PLA-DY650-injected (19 / 14), DMSO-injected (13 / 11). Scale bars: 20 μm (A), 5 μm (B-I,L) and 3 μm (J-K). (For interpretation of the references to colour in this figure legend, the reader is referred to the web version of this article.) |
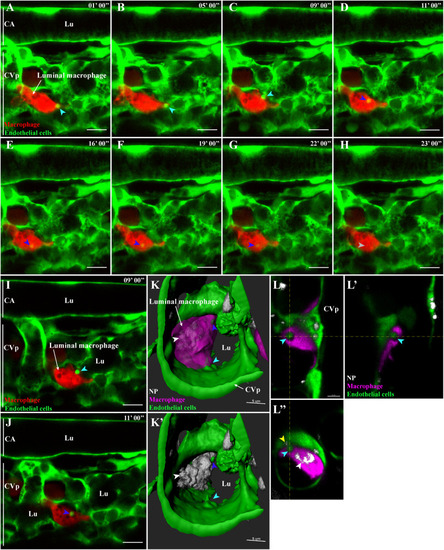
Microvesicle-like transfer from endothelial cells to macrophages. Representative live-acquisitions of 3 dpf mpeg1:mCherry and fli:GFP double transgenic zebrafish, 30 min after the intravenous injection of far-red fluorescent PLA-NP and using a spinning-disk confocal microscope. The acquisitions have been made in the tail region, at the caudal vein plexus. Endothelial cells, macrophages and PLA-NP are highlighted in green, red and white, respectively. (A-B) At the start of the video (9 μm MIP), close to a macrophage residing in the bloodstream, an endothelial cell from the caudal vein plexus is forming a bright GFP+ microvesicle-like structure (cyan arrowhead). (C) Nine minutes later, the microvesicle-like structure is released from the endothelial cell (cyan arrowhead), it is then quickly internalized by the adjacent macrophage (D - blue arrowhead). Once internalized, the fluorescence of the microvesicle-like structure rapidly fades (E-G - blue arrowheads) to finally disappear 13 min after its internalization (H – grey arrowhead). Optical sections (1 μm) from (C) and (D), (I) highlights the contact between the GFP+ microvesicle and the plasma membrane of the macrophage (cyan arrowhead), while (J) emphasize its internalization inside a mCherry negative cellular compartment (blue arrowhead). (K-K′) A luminal macrophage, positive for PLA-NP (white arrowhead) and with a GFP+ cellular compartment (blue arrowhead) is wrapping around a budding microvesicle-like structure of an endothelial cell from the caudal vein plexus (cyan arrowhead). Fluorescence are represented as 3D reconstructions. (L-L") Orthogonal views from (K) reveal the presence of PLA-NP in close proximity to the budding-microvesicle-like structure (yellow arrowhead). Annotations: CA, caudal artery; CVp, caudal vein plexus and Lu, lumen. Scale bars: 10 um (A-J), 5 μm (K-K′) and 4 μm (L). (For interpretation of the references to colour in this figure legend, the reader is referred to the web version of this article.) |
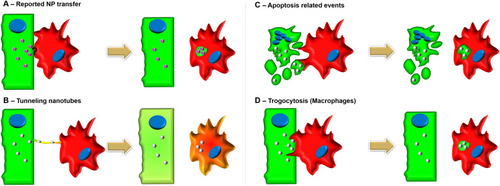
Illustrations of the reported NP transfer and known Cell-Cell transfer mechanisms. |