|
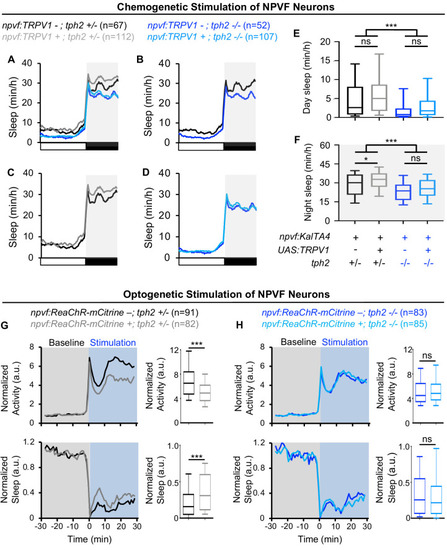
Sleep induced by chemogenetic or optogenetic stimulation of NPVF neurons is abolished in <italic>tph2</italic> mutant animals.(A) Sleep of 5-dpf Tg(npvf:KalTA4); tph2+/- (black), Tg(npvf:KalTA4); tph2-/- (dark blue), Tg(npvf:KalTA4); Tg(UAS:TRPV1-TagRFP-T); tph2+/- (gray), and Tg(npvf:KalTA4); Tg(UAS:TRPV1-TagRFP-T); tph2-/- (light blue) siblings treated with 2 μM Csn. White and black bars under behavioral traces indicate day and night, respectively. (E,F) Box plots quantify sleep during the day (E) and night (F). Chemogenetic stimulation of NPVF neurons increases sleep at night compared to non-transgenic sibling controls in tph2+/- animals (C,F) but not in tph2-/- siblings (D,F). n = number of animals. ns p>0.05, *p<0.05, ***p<0.005, Two-way ANOVA with Holm-Sidak test. (G,H) Normalized locomotor activity (top) and sleep (bottom) of Tg(npvf:ReaChR-mCitrine) (gray and light blue) and non-transgenic sibling control (black and dark blue) animals before (Baseline) and during exposure to blue light (Stimulation) in (G) tph2+/- or (H) tph2-/- animals. Box plots quantify locomotor activity and sleep for each animal during optogenetic stimulation normalized to the baseline of all animals with the same genotype. Optogenetic stimulation of NPVF neurons decreases locomotor activity and increases sleep compared to non-transgenic sibling controls in tph2+/- animals (G) but not in tph2-/- siblings (H). n = number of animals. ns p>0.05, ***p<0.005, Mann-Whitney test.
|