
Figure 2
- ID
- ZDB-FIG-201223-51
- Publication
- Lee et al., 2020 - Neuropeptide VF neurons promote sleep via the serotonergic raphe
- Other Figures
- All Figure Page
- Back to All Figure Page
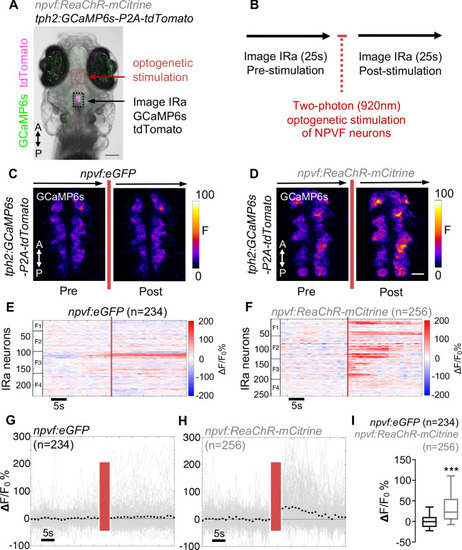
Optogenetic stimulation of NPVF neurons activates serotonergic IRa neurons. 6-dpf Tg(npvf:ReaChR-mCitrine); Tg(tph2:GCaMP6s-P2A-tdTomato) and Tg(npvf:eGFP); Tg(tph2:GCaMP6s-P2A-tdTomato) control animals were analyzed for GCaMP6s/tdTomato fluorescence levels in IRa neurons before and after optogenetic stimulation of NPVF neurons. (A) Example of a 6-dpf Tg(npvf:ReaChR-mCitrine); Tg(tph2:GCaMP6s-P2A-tdTomato) animal showing GCaMP6s and tdTomato fluorescence in IRa neurons with overlayed NPVF neurons (red circles, different z-plane) indicating region of optogenetic stimulation (red box). Black box indicates region where IRa neurons were imaged and analyzed in subsequent panels. Green and magenta signals in the eyes are due to autofluorescence. (B) Normalized GCaMP6s fluorescence in the IRa was first recorded for 25 s (20 frames). NPVF neurons were then optogentically stimulated for 3.7 s (red line), and normalized GCaMP6s fluorescence in the IRa was then immediately imaged again for 25 s. (C,D) Average GCaMP6s fluorescence in IRa neurons for 10 imaging frames before (Pre) and after (Post) optogenetic stimulation of NPVF neurons in Tg(npvf:eGFP); Tg(tph2:GCaMP6s-P2A-tdTomato) (C) and Tg(npvf:ReaChR-mCitrine); Tg(tph2:GCaMP6s-P2A-tdTomato) (D) animals. (E–H) Normalized GCaMP6s fluorescence of individual IRa neurons shown as heat maps (E,F), in which each horizontal line represents an IRa neuron, and as line graphs (G,H) showing individual (gray lines) and mean (dotted line) IRa neuron responses before and after optogenetic stimulation (red lines) in Tg(npvf:eGFP); Tg(tph2:GCaMP6s-P2A-tdTomato) control (E,G) and Tg(npvf:ReaChR-mCitrine); Tg(tph2:GCaMP6s-P2A-tdTomato) (F,H) animals. F1-F4 in (E,F) indicate neurons from four different fish. (I) Box plot of normalized GCaMP6s ΔF/F0 values from the average of the first 10 imaging frames post-stimulation of each neuron for Tg(tph2:GCaMP6s-P2A-tdTomato) animals that also contain either a Tg(npvf:eGFP) (black) or Tg(npvf:ReaChR-mCitrine) (gray) transgene. n = number of neurons quantified from four animals of each genotype. ***p<0.001, Mann-Whitney test. Scale: 100 μm (A), 10 μm (D). |