FIGURE

FIGURE 6

ID
ZDB-FIG-200808-8
Publication
Westhoff et al., 2020 - In vivo High-Content Screening in Zebrafish for Developmental Nephrotoxicity of Approved Drugs
Other Figures
All Figure Page
Back to All Figure Page
FIGURE 6

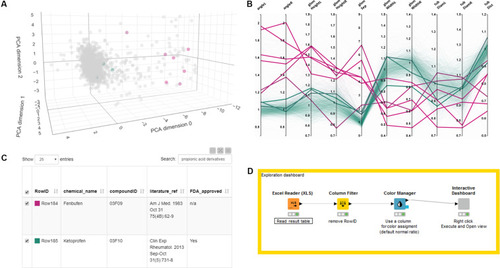
Exploring and browsing the generated zebrafish embryo nephrotoxicity dataset. Shown are screenshots of an interactive exploration tool generated using KNIME (see Supplementary Software S4). The workflow allows to visualize the full result table as well as a PCA scatter plot and a parallel coordinates line plot of the quantitative features in a single HTML window. The tool allows highlighting single compounds, compound groups or classes by selecting single lines in a parallel coordinates plot, sliders for limiting PCA range (not shown) or through searching in the data result table. Selected results are shown as colored dots in the PCA scatterplot, thicker lines in the parallel coordinates plot or as filtered rows in the results table. In this figure all panels show highlighted results for the propionic acid derivatives compound class. (A) PCA plot, (B) parallel coordinate plot, (C) result table. Color code for highlighted dots, lines or rows in panel (A–C) as in Figures 3, 4 with 0% (magenta, all abnormal) to 100% (green, all normal). (D) KNIME workflow generating the interactive tool. A video tutorial is available at https://youtu.be/A4Eqe1Aju4A. Permission to reuse and Copyright: It is made available under a CC-BY-ND 4.0 International license.

Expression Data

Expression Detail
Antibody Labeling
Phenotype Data

Phenotype Detail
Acknowledgments
This image is the copyrighted work of the attributed author or publisher, and ZFIN has permission only to display this image to its users. Additional permissions should be obtained from the applicable author or publisher of the image. Full text @ Front Cell Dev Biol