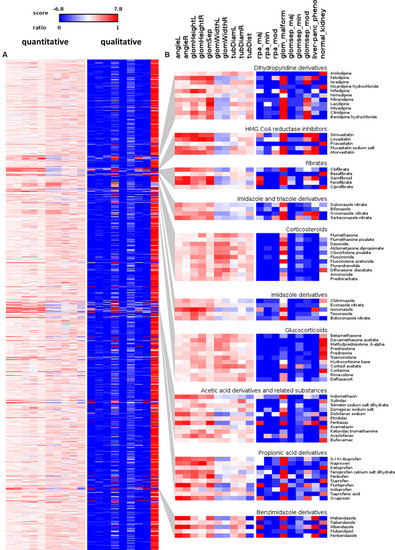
Overview of scored quantitative morphometric parameters and qualitative manual annotations. (A) Heat map visualizations illustrating the pronephric phenotypic alterations upon compound treatment for each assayed compound. Heat maps are sorted according to the D-level of the Anatomical Therapeutic Chemical (ATC) Classification System (for fully labeled heat maps please refer to Supplementary Figures S3, S4). The left panel shows quantitative parameters shown as color-coded z-score. Shown are z-score changes of pronephric angle left (angleL), pronephric angle right (angleR), glomerular height left (glomHeightL), glomerular height right (glomHeightR), glomerular separation (glomSep), glomerular width left (glomWidthL), glomerular width right (glomWidthR), tubular diameter left (tubDiamL), tubular diameter right (tubDiamR) and tubular distance (tubDist). See also labelling of heat map columns in panel (B). The right panel shows qualitative annotations as a ratio of embryos assigned with a certain category. Legend indicates colors assigned to values. Shown are ratios for reduced pronephros angle major (rpa_maj), reduced pronephros angle minor (rpa_min), reduced pronephros angle moderate (rpa_mod), glomerular malformation (glom_malform), glomerular separation major (glomsep_maj), glomerular separation minor (glomsep_min), glomerular separation moderate (glomsep_mod), impaired liver pancreas area (liver-panc_pheno) and normal kidney (normal_kidney). See also labeling of heat map columns in panel (B). (B) Magnified view on illustrative examples of compound classes enriched with substances causing pronephric phenotypes. Permission to reuse and Copyright: It is made available under a CC-BY-ND 4.0 International license.
|
