|
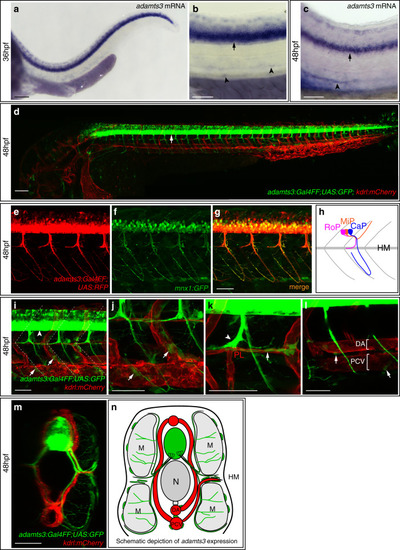
<italic>adamts3</italic> is expressed by motoneurons and additional cell types during venous sprouting stages.a–c Whole mount in situ hybridization against adamts3 at 36 and 48 hpf indicates strong expression in the spinal cord (arrow) and weaker expression of adamts3 transcripts around the axial blood vessels in the trunk (arrowheads). d The adamts3:Gal4FF; UAS:GFP transgenic reporter line shows very prominent expression (in green) in neuronal cells (arrow). e–g The adamts3:Gal4FF; UAS:RFP transgene shows expression in trunk neurons and axons that are also labeled by the motoneuronal marker mnx1:GFP at 48 hpf. h Diagram of the three different types of motoneurons per segment, differing in their axonal projections which either extend along the HM region (rostral primary motoneuron, RoP, shown in magenta), toward the dorsal side of the trunk (middle primary motoneuron, MiP, highlighted in orange) or that extend further ventrally, passing by the main axial blood vessels (caudal primary motoneuron, CaP shown in blue). i–ladamts3:Gal4FF; UAS:GFP; kdrl:mCherry transgenic embryos, highlighting adamts3 expression domains in green and ECs in red at 48 hpf. i Higher magnification of the trunk region, showing adamts3 reporter expression not only in neurons (arrowhead) but also in non-neuronal cells located at the segment boundaries (arrows). White lines indicate the position of the segment boundaries. j Higher magnification of the ventral trunk region, indicating the position of adamts3-expressing cells along the segment boundaries (arrows). k Partial z-projection of the HM region indicating expression of the adamts3 reporter (in green) in the RoP axon (arrowhead) and in cells along the HM (arrow), which are in close proximity to the PL cells (in red). l In partial z-projections of the trunk, individual adamts3-positive cells around the DA and the PCV are apparent (arrows). m Virtual cross section of the trunk region shown in i. n Schematic cross view illustrating the different adamts3 expression domains (green) in the trunk.; Scale bar in a, d: 100 µm; b, c, e–g, i–m: 50 µm. DA dorsal aorta, ECs endothelial cells, hpf hours post fertilization, HM horizontal myoseptum, M muscle, N notochord, PCV posterior cardinal vein, PL parachordal lymphangioblast.
|