|
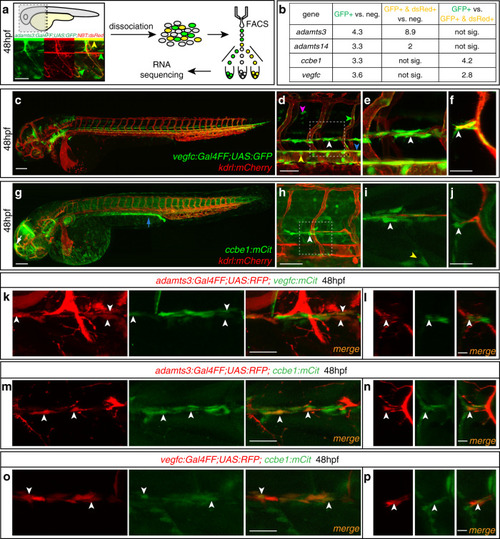
Non-neuronal <italic>adamts3</italic>-expressing cells co-express <italic>vegfc</italic> and <italic>ccbe1</italic>.a Strategy for transcript analysis of adamts3-expressing cell populations by RNA sequencing. adamts3:Gal4FF;UAS:GFP; NBT:dsRed-positive trunks were dissociated at 48 hpf and cells were FAC-sorted into (1) adamts3-expressing neurons (GFP + /dsRed+, yellow arrowhead), (2) adamts3 + non-neuronal cells (GFP+, green arrowheads) and (3) a negative control. Pooled cell populations were analyzed by RNA sequencing. b Summary of RNA sequencing analysis. Values reflect fold-changes in transcript abundance for indicated genes upon comparison of cell populations stated in the column headings. To identify significant gene expression differences, p values were determined by Wald test and an FDR < 0.05 and FDR-adjusted p value < 0.1 cutoff was used (source data are provided as a Source Data file). c Lateral view of a vegfc:Gal4FF; UAS:GFP; kdrl:mCherry transgenic embryo at 48 hpf. d Higher magnification showing vegfc expression in HM cells (white arrowhead), in the hypochord (blue arrowhead), the DA (yellow arrowhead), in arteries (green arrowhead) and in neurons (magenta arrowhead). e Zoom-in of the boxed region in (d) highlighting vegfc-expressing cells at the HM (arrowhead). f Virtual cross section focusing on the HM, showing juxtaposition between a PL and vegfc-expressing cells (arrowhead). g Lateral view of a ccbe1:mCitrine; kdrl:mCherry transgenic embryo at 48 hpf showing ccbe1 expression in the pronephros (blue arrow) and epiphysis (white arrow). h Higher magnification demonstrating ccbe1 expression at the HM (arrowhead). i Partial projection of the marked region in (h) showing ccbe1-expressing cells at the HM (white arrowhead) and the segment boundary (yellow arrowhead). j Virtual cross section indicating ccbe1+ cells at the HM (arrowhead). k, m, o Lateral views (partial z-projections) and l, n, p virtual cross sections of the HM region at 48 hpf. Arrowheads indicate cells with co-expression of the indicated transgenes. k, ladamts3 and vegfc are co-expressed by individual cells at the HM. m, n Mesenchymal cells at the HM co-express adamts3 and ccbe1. o, p Overlapping expression of vegfc and ccbe1 in HM cells. Scale bars in a, d, h: 50 µm; c, g: 100 µm; f, j, k, m, o 25 µm; l, n, p: 10 µm. DA dorsal aorta, HM horizontal myoseptum, hpf hours post fertilization, neg. negative cell population, sig. significant.
|