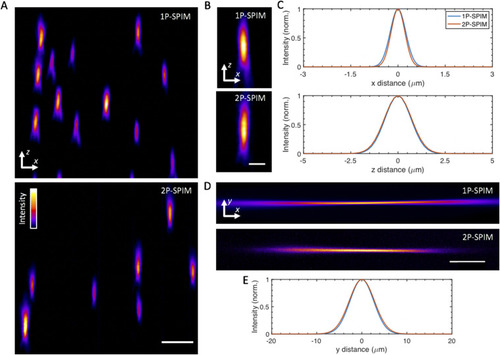
System imaging performance and characterization. (a) y maximum-intensity projections of agarose-embedded 175 nm fluorescent beads imaged at 44× magnification in 1P (top) and 2P excitation mode (bottom). A false-color (fire) lookup table was used to enhance visualization. (b) Selected y maximum-intensity projections of sub-diffraction fluorescent beads in 1P (top) and 2P mode (bottom). (c) Averaged lateral (top) and axial (bottom) full-width at half-maximum (FWHM) extents for the imaged beads, determined by Gaussian fits of 7 bead intensity profiles. The averaged lateral and axial FWHM ±SD values are 1P, 579 ± 15 nm and 1.67 µm± 118 nm, respectively, and 2P, 528 ± 50 nm and 1.78 µm ± 183 nm, respectively. Similar measurements at 11× magnification yield 1P, 1.2 µm ± 86 nm and 1.73 µm ± 387 nm and 2P, 1.17 µm ± 232 nm and 1.81 µm ± 370 nm for lateral and axial directions, respectively. (d) Experimental images of fluorescence excited by 1P (top) and 2P (bottom) Gaussian focused beams, which are scanned in the y direction to create virtual light-sheets. Images were acquired by illuminating a solution of rhodamine in the sample chamber. (e) Intensity line profiles for the focused beams in (d), taken at the center of focus, with approximate FWHM values: 1P, 6.2 µm and 2P, 6.6 µm. These FWHM values yield an averaged light-sheet thickness of ∼10 µm across the 400 µm extent along the x direction, centered around the Gaussian focus. Scale bars: (a) 5 µm, (b) 2.5 µm, and (d) 150 µm.
|
