IMAGE

FIG. 7.

ID
ZDB-IMAGE-200606-7
Source
Figures for Keomanee-Dizon et al., 2020
Image
Figure Caption

FIG. 7.

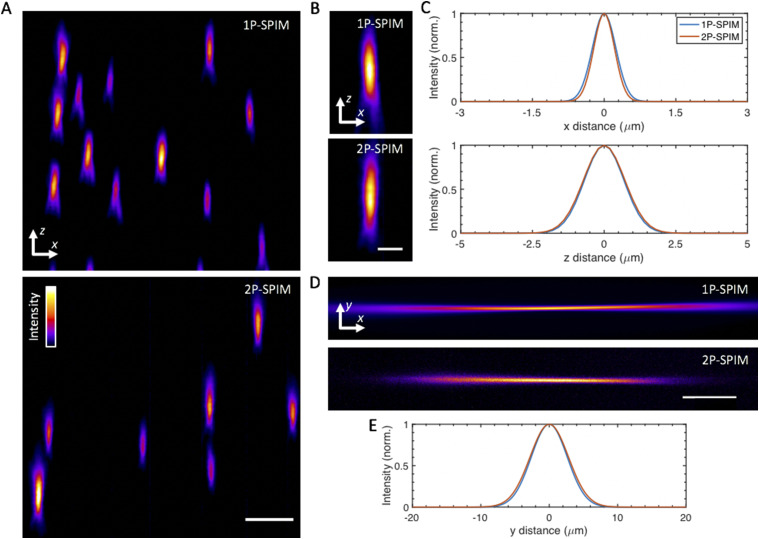
System imaging performance and characterization. (a) y maximum-intensity projections of agarose-embedded 175 nm fluorescent beads imaged at 44× magnification in 1P (top) and 2P excitation mode (bottom). A false-color (fire) lookup table was used to enhance visualization. (b) Selected y maximum-intensity projections of sub-diffraction fluorescent beads in 1P (top) and 2P mode (bottom). (c) Averaged lateral (top) and axial (bottom) full-width at half-maximum (FWHM) extents for the imaged beads, determined by Gaussian fits of 7 bead intensity profiles. The averaged lateral and axial FWHM ±SD values are 1P, 579 ± 15 nm and 1.67 µm± 118 nm, respectively, and 2P, 528 ± 50 nm and 1.78 µm ± 183 nm, respectively. Similar measurements at 11× magnification yield 1P, 1.2 µm ± 86 nm and 1.73 µm ± 387 nm and 2P, 1.17 µm ± 232 nm and 1.81 µm ± 370 nm for lateral and axial directions, respectively. (d) Experimental images of fluorescence excited by 1P (top) and 2P (bottom) Gaussian focused beams, which are scanned in the y direction to create virtual light-sheets. Images were acquired by illuminating a solution of rhodamine in the sample chamber. (e) Intensity line profiles for the focused beams in (d), taken at the center of focus, with approximate FWHM values: 1P, 6.2 µm and 2P, 6.6 µm. These FWHM values yield an averaged light-sheet thickness of ∼10 µm across the 400 µm extent along the x direction, centered around the Gaussian focus. Scale bars: (a) 5 µm, (b) 2.5 µm, and (d) 150 µm.

Acknowledgments
This image is the copyrighted work of the attributed author or publisher, and ZFIN has permission only to display this image to its users. Additional permissions should be obtained from the applicable author or publisher of the image. Full text @ Rev. Sci. Instrum.