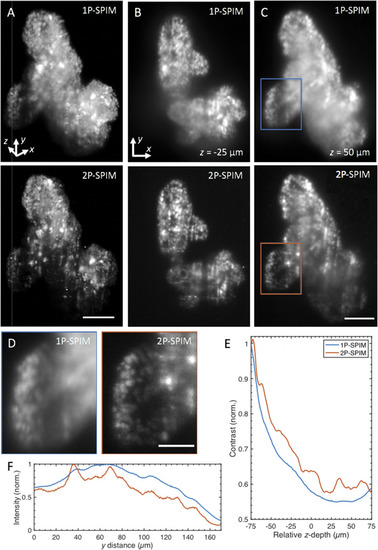
1P- and 2P-SPIM imaging of thick tumor organoids derived from a patient with colorectal cancer. (a) Volume rendering of fixed patient-derived tumor organoids expressing nuclear-localized H2B-GFP recorded in 1P (top) and 2P mode (bottom). Renderings show that the reduced background of 2P-SPIM enables better contrast throughout the imaged volume compared to 1P-SPIM. 3D organoid volume of ∼400 × 550 × 150 (x–y–z) μm3 captured with a magnification of 11×, 1-µm z-steps, and 150 ms exposure time. Figure 11 (Multimedia view) rotates the 3D-rendered volume of the same datasets. (b) and (c) are x–y image slices of (a) at z = −25 µm (50 µm from the surface) and z = 50 µm (125 µm from the surface), respectively. (d) Magnified images of the boxed regions in (c) for 1P (left) and 2P (right) mode revealing that 2P-SPIM resolves more cells than 1P-SPIM deep in the sample. (e) Quantification of image contrast as a function of z-depth. This plot shows quantitatively the improved contrast of 2P-SPIM over 1P-SPIM throughout the imaged volume in (a). Contrast calculated from the standard deviation of the pixel intensities from each x–y image slice and then normalized by the corresponding average image intensity. Each slice (from both modalities) is normalized against the surface slice (z = −75 µm) of 1P-SPIM to show the degradation of performance as a function penetration depth. (f) Plot shows sum intensity along the x direction of images in (d) as a function of light-sheet propagation distance y. The longer NIR wavelength used in 2P-SPIM minimizes the scattering-induced degradation of the excitation light-sheet over longer propagation distances compared to the visible light used in 1P-SPIM. In both intensity profiles, intensity values were normalized by the global maximum. Scale bars: (a) and (c) 100 µm and (d) 50 µm.
|
