
FIGURE
Figure 3—figure supplement 3—source data 1.
- ID
- ZDB-FIG-200220-45
- Publication
- He et al., 2020 - In vivo single-cell lineage tracing in zebrafish using high-resolution infrared laser-mediated gene induction microscopy
- Other Figures
- All Figure Page
- Back to All Figure Page
Figure 3—figure supplement 3—source data 1.
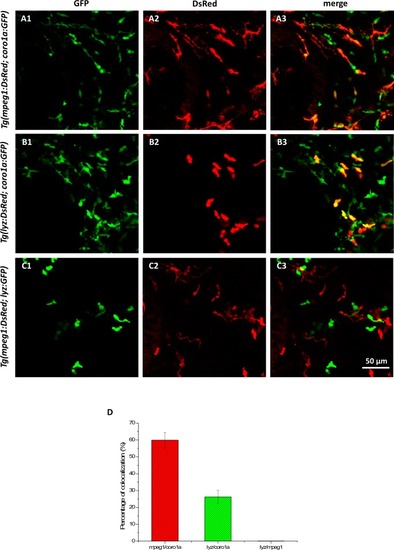
Verification of myeloid cells on the trunk of the single-HE labeled zebrafish at 7dpf.(A1–A3) In vivo dual-color imaging of leukocytes (coro1a:GFP) and macrophages (mpeg1:DsRed). (B1–B3) In vivo dual-color imaging of leukocytes (coro1a:GFP) and neutrophils (lyz:DsRed). (C1–C3) In vivo dual-color imaging of neutrophils (lyz:GFP) and macrophages (mpeg1:DsRed). (D) The colocalization percentages of mpeg1+/coro1a+ and lyz+/coro1a+ cells are 59.9% and 26.3%, respectively (n = 3), while lyz+ cells are not colocalized with mpeg+ cells, indicating that the majority of coro1a+ cells (86.2%) on the trunk are lyz+ or mpeg1+ myeloid cells. |
Expression Data
Expression Detail
Antibody Labeling
Phenotype Data
Phenotype Detail
Acknowledgments
This image is the copyrighted work of the attributed author or publisher, and
ZFIN has permission only to display this image to its users.
Additional permissions should be obtained from the applicable author or publisher of the image.
Full text @ Elife