
Figure 3—figure supplement 2.
- ID
- ZDB-FIG-200220-44
- Publication
- He et al., 2020 - In vivo single-cell lineage tracing in zebrafish using high-resolution infrared laser-mediated gene induction microscopy
- Other Figures
- All Figure Page
- Back to All Figure Page
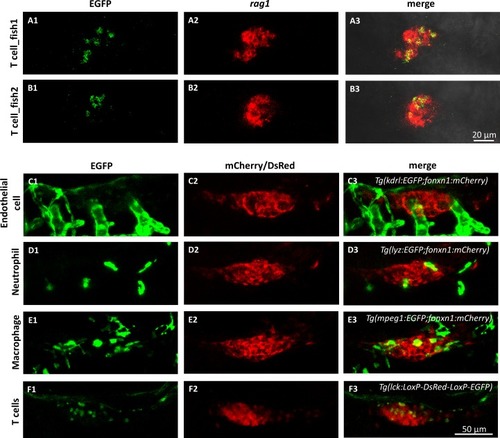
Verification of T cells in the thymus of the single-HE labeled zebrafish at 7dpf.(A1 and B1) The representative images (by maximum projections) of antibody stained EGFP+ cells in the thymus of triple Tg zebrafish. (A2 and B2) The patterns of rag1 expression in the thymus (by maximum projections) revealed by whole-mount in situ hybridization. (A3 and B3) The colocalization of EGFP with rag1 expression indicates that the EGFP+ cells in the thymus of 7dpf zebrafish are T cells. In addition, T cells (F) can be distinguished from other cell types (C–E) in the thymus based on their small and round shapes. (C) In vivo dual-color imaging of blood vessel endothelium (EGFP) and thymus epithlium (mCherry). (D) In vivo dual-color imaging of neutrophils (EGFP) and thymus epithlium (mCherry). (E) In vivo dual-color imaging of macrophages (EGFP) and thymus epithlium (mCherry). (F) In vivo dual-color imaging of heat shocked T cells (EGFP) and non-heat shocked T cells in thymus (DsRed). |