
Figure 3
- ID
- ZDB-FIG-200220-42
- Publication
- He et al., 2020 - In vivo single-cell lineage tracing in zebrafish using high-resolution infrared laser-mediated gene induction microscopy
- Other Figures
- All Figure Page
- Back to All Figure Page
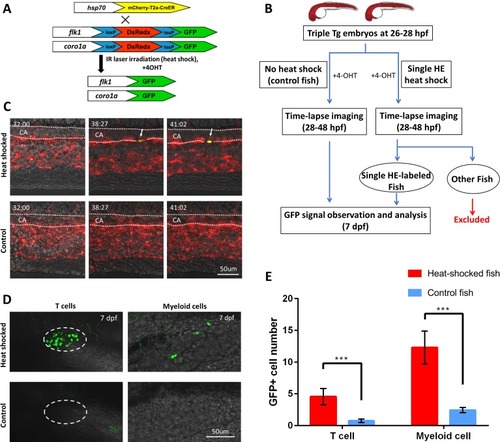
The high-precision IR-LEGO-mediated single HE lineage tracing.(A) The genetic labeling diagram of the lineage tracing experiment. The heat shock-induced CreERT2 line Tg(hsp70l:mCherry-T2a-CreERT2) is crossed with the double reporter fish Tg(kdrl:loxP-DsRedx-loxP-EGFP;coro1a:loxP-DsRedx-loxP-EGFP) to obtain triple transgenic Tg(kdrl:loxP-DsRedx-loxP-EGFP; coro1a:loxP-DsRedx-loxP-EGFP; hsp70l:mCherry-T2a-CreERT2) embryo. Upon IR laser illumination, the targeted HEs will express CreER. After 4-OHT treatment, the CreER will enter the cell nucleus and remove the DsRedx cassettes flanked by loxP from the genome. After that, the target HEs and their hematopoietic progenies will express GFP signal, thus be distinguished from the unlabeled DsRedx+cells. (B) The work flow of the IR-LEGO-mediated single HE lineage tracing assay. (C) Representative time-lapse images of the single-HE heat-shocked embryos (upper row) and control embryos (lower row). Dotted lines depict the caudal aorta (CA) in the PBI region (dorsal wall on the top). Number at the top left corner in each image indicates the developmental stage of the embryos (hh:mm post fertilization). The heat-shock labeled HE (white arrow) on the ventral wall of CA gradually turns on the expression of GFP without affecting neighbor HEs, while the HEs in control embryos do not express GFP during time-lapse imaging. (D) Images of GFP+ T cells and myeloid cells in single-HE labeled fish and control fish at 7 dpf (back on the top). The left column shows small and round coro1a:GFP+ T cells in the thymus (depicted by dashed lines). The right column shows coro1a:GFP+ myeloid cells on the trunk, which have irregular shape. While GFP+ T cells and myeloid cells are persistently observed in many of the labeled fish (upper row), rare GFP signals are detected in most of the control fish (lower row). (E) Quantification of GFP+ T cells and myeloid cells in both single HE-labeled fish (n=27) and control fish (n=109) at 7 dpf. Statistical analysis indicates that for both T cells and myeloid cells, the GFP+ cell number in heat-shock labeled fish is significantly higher than that in control fish. The cell numbers are shown in terms of mean ± standard error of the mean. The Mann–Whitney–Wilcoxon rank-sum test was used for significance test. ***P < 0.001. |