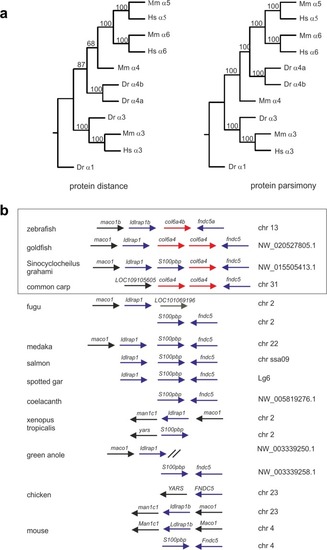
Phylogenetic analysis of zebrafish ColVI genes. (a) Phylogenetic trees of the ColVI α4, α5 and α6 chains in different species, obtained by amino acid sequence comparison of the regions spanning the C1 and C2 domains in the corresponding α chains. The sequences from zebrafish (z), mouse (m) and human (h) were aligned using the PILEUP program of the GCG package, using default parameters. The trees were constructed using the PROTEIN PARSIMONY, PROTEIN DISTANCE, FITCH and CONSENSE tools of the PHYLIP package version 3.69. Bootstrap analyses using 100 replicates were performed to show the significance. Numbers indicate the statistical weight of the individual branches. The C1 and C2 domains of zebrafish ColVI α1 chain were used as outgroup. (b) Comparative maps of syntenic regions of the zebrafish col6a4b gene. Genes encoding the corresponding α4 chain in different species are indicated by red arrows. Neighboring syntenic genes are indicated by blue arrows. For simplicity, the orientation of the genes on the chromosomes was adjusted to that of zebrafish chromosome 13. Members of the carp family (Cyprinidae) are boxed.
|
