
Figure 5
- ID
- ZDB-FIG-191230-1807
- Publication
- Gancz et al., 2019 - Distinct origins and molecular mechanisms contribute to lymphatic formation during cardiac growth and regeneration
- Other Figures
- All Figure Page
- Back to All Figure Page
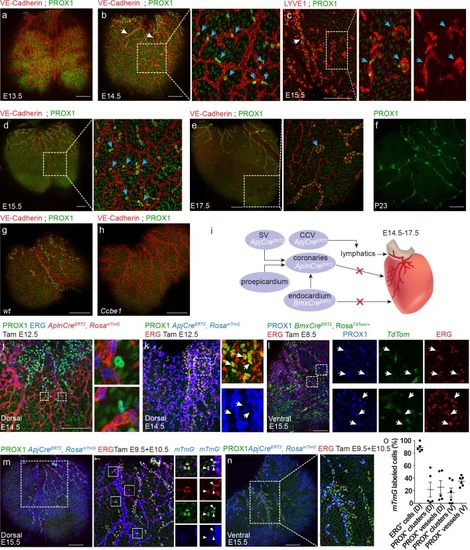
(a,b) Whole mount confocal images of mouse hearts immunonstained for VE-Cadherin and PROX1. (a) At E13.5 coronary (red) but not lymphatic vessels (green) are present on the ventricle surface (n = 6) (Low levels of PROX1 are detected in cardiomyocytes). (b) In addition to regular lymphatic vessels (white arrows), isolated PROX1+ LECs are observed in close proximity to the coronaries at E14.5 (inset, blue arrows) (n = 6). (c) Whole mount confocal images of E15.5 mouse hearts immunonstained for LYVE1 and PROX1. Isolated PROX1+/LYVE1+ LECs (blue arrows) are not connected to the main lymphatic sprouts (white arrow). (d,e) Whole mount confocal images of mouse hearts immunonstained for VE-Cadherin and PROX1. Isolated LECs gradually expand to form multicellular lumenized structures (inset, arrows) (n = 4). (f) PROX1+ isolated LECs are no longer detected at P23 (n = 4). (g,h) Whole mount confocal images of E15.5 mouse hearts immunonstained for LYVE1 and PROX1. PROX1+ LECs are absent from Ccbe1 mutant hearts (h) (nwt = 3, nCcbe1 = 3). (i) Lineage-tracing strategies for identification of cardiac LEC origins. (j) Dorsal view of AplnCreERT2,RosamTmG heart from embryo dosed with tamoxifen at E12.5 and analyzed at E14.5, showing no AplnCreERT2;PROX1+ LECs. Cre recombination is labeled in red, ECs in blue (Erg) and lymphatics in green (PROX1). Insets are magnification of dashed boxes. (n = 7). (k) Dorsal view of ApjCreERT2,RosamTmG heart, showing that PROX1+ LECs are not labeled by ApjCreERT2 in embryos dosed with tamoxifen at E12.5 and analyzed at E14.5. Cre recombination is marked in blue, ECs in red (ERG) and lymphatics in green (PROX1). Insets are magnification of dashed boxes (n = 4). (l) Ventral view of heart from BmxCreERT2, RosaTdTom embryos dosed with tamoxifen at E8.5 and analyzed at E15.5, showing that PROX1+ LECs are not labeled by BmxCreER. Cre recombination is marked in green, ECs in red (ERG) and lymphatics in blue (PROX1). Inset is magnification of dashed boxes. (n = 5). Dorsal (m) and ventral (n) views of ApjCreERT2,RosamTmG embryos dosed with tamoxifen at E9.5 and 10.5 and analyzed at E15.5, showing PROX1+ isolated LECs and lymphatic vessels, labeled by ApjCreERT2. Cre recombination is marked in blue, ECs in red (ERG) and lymphatics in green (PROX1). (o) Quantification of mTmG labeling shows reduced ApjCreERT2 lineage traced PROX1+ cells as compared to ERG ECs (recombination efficiency). D;Dorsal, V;Ventral (nD = 5, nV = 6) Insets are magnification of dashed boxes. (nDorsal = 6, nVentral = 5). Scale bars are 200 µm. |