
Fig. S3
- ID
- ZDB-FIG-191118-9
- Publication
- Ando et al., 2019 - Peri-arterial specification of vascular mural cells from naïve mesenchyme requires Notch signaling
- Other Figures
- All Figure Page
- Back to All Figure Page
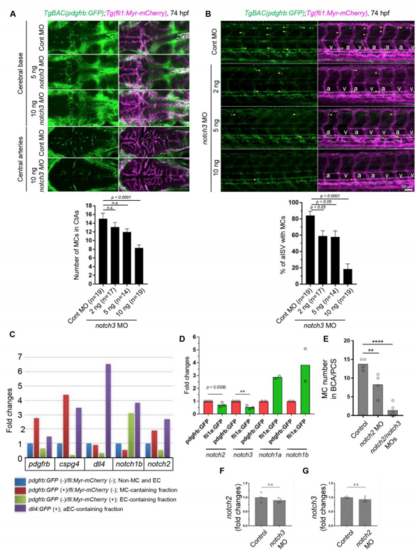
Effects of notch2 or notch3 depletion on MC emergence. (A) Confocal stack images of brain vessels in the 74 hpf TgBAC(pdgfrb:GFP);Tg(fli1a:Myr-mCherry) larvae injected with 10 ng control MO or 2-10 ng notch3 MO. The MC number in central arteries of larvae injected with control MO or 2-10 ng notch3 MO is shown on the bottom of confocal images. (B) Confocal stack images of trunk vessels in the 74 hpf Development: doi:10.1242/dev.165589: Supplementary information Development • Supplementary information TgBAC(pdgfrb:GFP);Tg(fli1a:Myr-mCherry) larvae injected with 10 ng control MO or 2-10 ng notch3 MO. Arrowheads indicate MCs in ISVs. a, aISV. v, vISV, The percent of aISV covered by pdgfrbhigh MCs is shown on the bottom of confocal images. The percentage of aISV with MCs was significantly reduced at 10 ng notch3 MO, however, even 10 ng notch3 MO did not completely block the MC-emergence in aISV and beneath the DA. (C) qPCR analysis of pdgfrb, cspg4, dll4, notch1b, and notch2 expression. The TgBAC(pdgfrb:GFP);Tg(fli1a:Myr-mCherry) or Tg(dll4:GFP) larvae at 4 dpf were subjected to FACS Aria and pdgfrb-GFP (-)/fli1a-mCherry (-), pdgfrb-GFP (+)/fli1a-mCherry (-), pdgfrb-GFP (-)/fli1a-mCherry (+), or dll4-GFP (+) cells were sorted. Then, after purification of mRNAs from sorted cells and subsequent cDNA synthesis, qPCR analysis was performed against targets in the figure. (D) pdgfrb:GFP (+) or fli1a:GFP (+) cells were sorted from 72 hpf TgBAC(pdgfrb:GFP) or Tg(fli1a:GFP) larvae and subjected to qPCR analysis of notch2, notch3, notch1a, and notch1b expression. While notch2 and notch3 expressions were higher in MC-containing pdgfrb+ population, notch1a and notch1b expression were higher in ECcontaining fli1a+ population. (E) The MC number in BCA and PCS of 78 hpf larvae injected with 10 ng control MO, 10 ng notch2 MO, or 5 ng each of notch2 and notch3 MOs, shown in Fig. 3A. (F, G) qPCR analysis of notch2 or notch3 expression in whole 72 hpf larvae injected with 5 ng notch3 MO or 5 ng notch2 MO, respectively. **p<0.01, and ****p<0.0001, significant difference between indicated two groups. n.s., not significant between two groups |