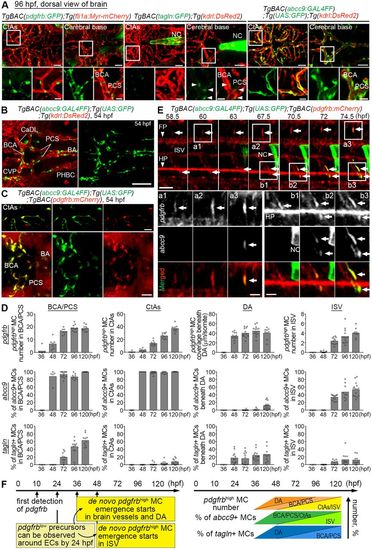
MC marker expression during early developmental stages. (A) Confocal stack images of the brain vasculature of 96 hpf TgBAC(pdgfrb:GFP);Tg(fli1a:Myr-mCherry) (left), TgBAC(tagln:GFP);Tg(kdrl:DsRed2) (middle) or TgBAC(abcc9:GAL4FF);Tg(UAS:GFP);Tg(kdrl:DsRed2) (right) larvae. CtAs or the vessels in the cerebral base such as the BCA, PCS and BA are shown in the top rows, and the boxed regions are enlarged in the bottom rows. Note that pdgfrb- and abcc9 reporter-positive MCs were readily observed, whereas tagln reporter expression was faint in BCA and PCS (arrowheads) and not detected in CtAs. (B,C) Confocal stack images of the brain vasculature of 54 hpf TgBAC(abcc9:GAL4FF);Tg(UAS:GFP);Tg(kdrl:DsRed2) (B) or TgBAC(abcc9:GAL4FF);Tg(UAS:GFP);Tg(pdgfrb:mCherry) embryos (C). abcc9-positive cells were observed only around vessels (B) and these abcc9-positive cells were positive for pdgfrb:mCherry expression (C). Note that pdgfrb:mCherry expression was broadly detected in the cerebral base but only pdgfrbhigh cells around these vessels expressed the abcc9 reporter. (D) Changes of pdgfrbhigh MC number (top row), percentage of abcc9 reporter-positive (middle row) or percentage of tagln reporter-positive (bottom row) pdgfrbhigh MCs at indicated time points and vessels. The number of pdgfrbhigh MCs in ISV is shown per somite in one side of the trunk. (E) Time-lapse imaging of the trunk region of TgBAC(abcc9:GAL4FF);Tg(UAS:GFP);TgBAC(pdgfrb:mCherry) embryo at indicated time points. Boxed regions are enlarged to the bottom. Increase of pdgfrb:mCherry signal could be observed after 67.5 hpf (arrows). Soon after the increase of pdgfrb:mCherry signal, GFP expression was observed only in these pdgfrbhigh cells (arrows). (F) Schematic time course of pdgfrb-positive cell emergence (left) ( Ando et al., 2016) and the changes of pdgfrbhigh-, abcc9-positive or tagln-positive MCs in brain vessels (BCA/PCS, CtAs), DA or ISV, based on D (right). Peri-arterial pdgfrblow precursors can be detected by 24 hpf. Subsequently, the specification from those pdgfrblow precursors into pdgfrbhigh MCs takes place, and the expression of other MC markers is induced in pdgfrbhigh MCs at the cerebral base and beneath the DA after 36 hpf, as well as in the ISV after 48 hpf. BA, basilar artery; CaDl, caudal division of the internal carotid artery; CVP, choroidal vascular plexus; FP, floor plate; HP, hypochord; NC, notochord; PHBC, primordial hindbrain channel. Scale bars: 50 µm in A,E; 100 µm in B; 30 µm in C; 20 µm in enlarged images in A,E.
|
