
Fig. S4
- ID
- ZDB-FIG-191118-10
- Publication
- Ando et al., 2019 - Peri-arterial specification of vascular mural cells from naïve mesenchyme requires Notch signaling
- Other Figures
- All Figure Page
- Back to All Figure Page
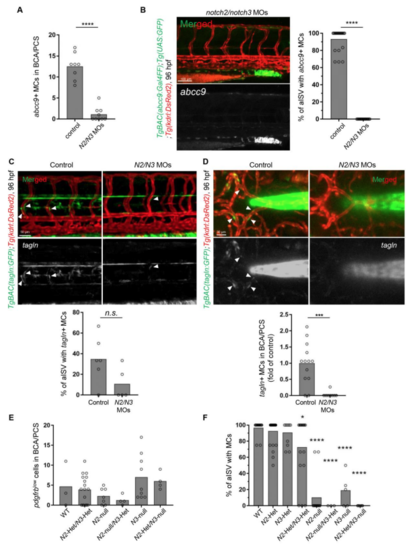
Effects of both notch2 and notch3 depletion on MC emergence. (A) The number of abcc9+ MCs in BCA and PCS in Fig. 3D. (B) Confocal stack images of trunk vessels in the 96 hpf TgBAC(abcc9:GAL4FF);Tg(UAS:GFP);Tg(kdrl:DsRed2) larva injected Development: doi:10.1242/dev.165589: Supplementary information Development • Supplementary information with 5 ng each of notch2 MO and notch3 MO (N2/N3 MOs). The percent of aISV covered by abcc9+ MCs is shown on the right. (C, D) Confocal stack images of trunk vessels (C) or vessels located on cerebral base (D) in the 96 hpf TgBAC(tagln:GFP);Tg(kdrl:DsRed2) larvae injected with 5 ng each of notch2 MO and notch3 MO (N2/N3 MOs). The percent of aISV covered by tagln+ MCs (C) or the number of tagln+ MCs in BCA/PCS (D) are shown on the bottom of images. (E) The number of pdgfrblow cells in BCA and PCS of notch2/notch3 (N2/N3) mutants observed in Fig. 3E. No significant differences between WT and any mutants. (F) The percent of aISV with MCs in notch2/notch3 (N2/N3) mutants observed in Fig. 3G. *p<0.05, ***p<0.001, and ****p<0.0001, significant difference comparing to control or WT. n.s., not significant between two groups. |