
Fig. S6
- ID
- ZDB-FIG-191118-12
- Publication
- Ando et al., 2019 - Peri-arterial specification of vascular mural cells from naïve mesenchyme requires Notch signaling
- Other Figures
- All Figure Page
- Back to All Figure Page
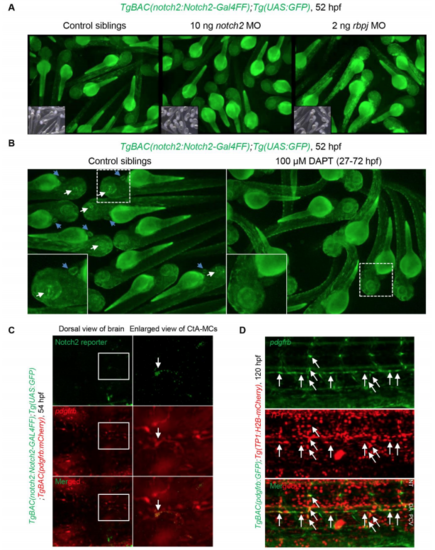
Visualization of Notch activity. (A) The 52 hpf TgBAC(notch2:Notch2- GAL4FF);Tg(UAS:GFP) uninjected embryos (Control siblings) or embryos injected with 10 ng notch2 MO or 2 ng rbpj MO. Bright field images are inserted bottom left of each UAS:GFP images. Note that GFP expression was canceled by notch2 MO whereas that was enhanced by rbpj MO. (B) The 72 hpf TgBAC(notch2:Notch2-GAL4FF);Tg(UAS:GFP) Development: doi:10.1242/dev.165589: Supplementary information Development • Supplementary information larvae treated with DMSO or 100 μM DAPT from 22 to 72 hpf. Boxed regions are enlarged to bottom left of each images. GFP signals detected in the heart (blue arrows) or in the eye (white arrows) in control siblings were inhibited in DAPT treated larvae, although the reduction of GFP signal in trunk was not apparent in this DAPT treatment condition. (C) Confocal stacked images of 54 hpf brain (dorsal view) of TgBAC(notch2:Notch2- GAL4FF);Tg(UAS.GFP);TgBAC(pdgfrb:mCherry) embryos. Arrows indicate faint Notch2- activation in a CtA-MC. Embryos with Notch2-activity positive MCs in brain at 54 hpf were 7.14 % (1/14 embryos). (D) Confocal stacked images of trunk region of 120 hpf TgBAC(pdgfrb:GFP);Tg(TP1:H2B-mCherry) larva. Arrows indicate TP1 positive MCs. |