
Fig. 7
- ID
- ZDB-FIG-191021-7
- Publication
- Callahan et al., 2019 - Spinal V2b neurons reveal a role for ipsilateral inhibition in speed control
- Other Figures
- All Figure Page
- Back to All Figure Page
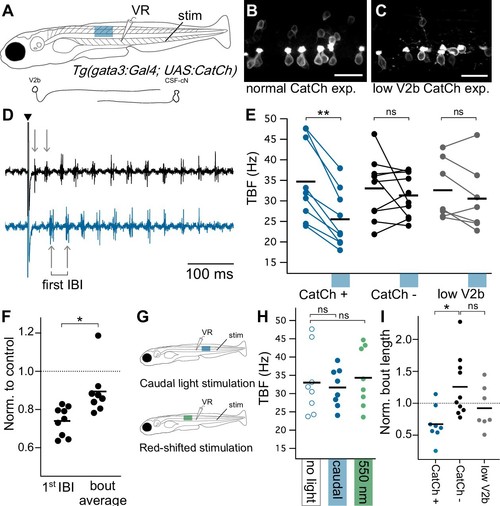
Optogenetic activation of Gata3+ neurons leads to decreased locomotor speeds.( A) Schematic of ventral root recording and electrical tail stimulation with rostrally-positioned optogenetic stimulation in Tg(gata3:Gal4; UAS:CatCh) animals. Representation of V2b and CSF-cN cellular morphology. Confocal z-projections show CatCh expression in one segment of spinal cord in ( B) an animal with broad CatCh expression in V2b and CSF-cN cell types and ( C) an animal with low CatCh expression in V2b neurons. Scale bars = 20 μm. ( D) Example recording of ventral root motor activity after electrical stimulation (caret) showing the swim rhythm in the control (black) and optogenetically stimulated trial (blue) for the same animal. Arrows distinguish the first inter-burst interval (IBI), showing a difference in tail beat frequency. ( E) Multi-trial average of first IBI compared between trials with (blue x-axis bar) and without optogenetic stimulation for animals with broad CatCh expression (CatCh+), sibling controls (CatCh-), and low V2b-expressing CatCh+ animals (low V2b). Dashes represent cohort averages. **p<0.001 (p=1.72×10⁻⁴). ( F) TBF during rostral optogenetic stimulation normalized to no-light control for the first IBI and swim bout average IBI. *p<0.01 (p=1.23×10⁻³). ( G) Experimental schematic of additional control experiments including a caudally-located stimulation (top) and a red-shifted light stimulation (bottom). ( H) Multi-trial average of first IBI in Tg(gata3:Gal4; UAS:CatCh)animals with broad CatCh expression show that caudal stimulation (blue) and red-shifted light stimulation controls (green) do not vary from baseline non-optogenetic stimulation IBIs (open circles). ( I) Bout duration during rostral optogenetic stimulation is shown normalized to the baseline bout duration *p<01 (p=4.65×10⁻³). Broad CatCh-expressing animals, n = 9, CatCh- siblings, n = 10, low V2b expression, n = 7. |
| Gene: | |
|---|---|
| Fish: | |
| Anatomical Terms: | |
| Stage: | Day 5 |