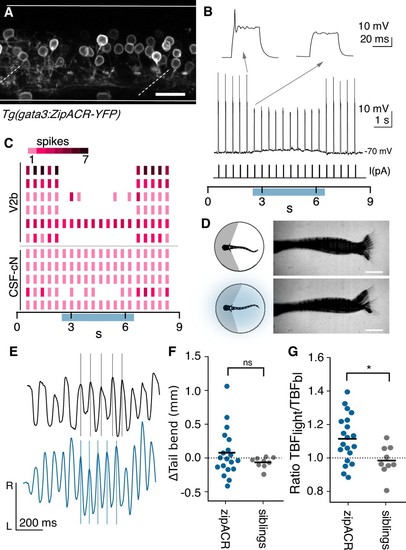
( A) Z-projection of Tg(gata3:zipACR-YFP) over one full segment of spinal cord showing expression in V2b but not CSF-cN somata. CSF-cN apical extentions show some YFP expression. Scale bar = 20 μm. ( B) A whole cell recording during repeated current steps (30 ms duration) is shown for an example V2b neuron in a Tg(gata3:zipACR-YFP) animal. Blue bar indicates period of optical stimulation. An expanded view of current steps before and during optical stimulation are shown above with arrows. Recordings indicate that current steps normally elicit bursts of action potentials, but coincident optogenetic suppression prevents spiking, yielding only subthreshold depolarizations. ( C) Raster plot of action potentials for 6 V2b cells and 5 CSF-cN cells summarizes optogenetic suppression across cell types. Color value represents number of spikes elicited during each current step. 5/6 V2b neurons were mostly or entirely suppressed, whereas only 1/5 CSF-cN were affected. ( D) Schematic of behavioral recording depicting the NMDA-induced tail movements of spinalized head-embedded animals without and with optogenetic stimulation. Image overlay of 100 ms of tail movements without and with light stimulation in a Tg(gata3:zipACR-YFP) animal show similar amplitude tail displacement during swim. Scale bar = 0.5 mm. ( E) Tracked left-right tail position during recordings with (blue) and without (black) optical stimulation for the same Tg(gata3:zipACR-YFP) animal. Lines for each recording are aligned to consecutive peaks in the baseline trace to illustrate the phase advance and increased tail beat frequency during optogenetic stimulation. ( F) Average change in tail bend amplitude between stimulation and control recordings during swim movements for each animal, ns (p=0.14). ( G) Ratio of average TBF during stimulation to baseline TBF for each animal, cohort averages shown with black dash. N = 20 Tg(gata3:zipACR-YFP) and N = 9 siblings. *p<0.01 (p=7.23×10⁻³).