
Fig. 3
- ID
- ZDB-FIG-191021-3
- Publication
- Callahan et al., 2019 - Spinal V2b neurons reveal a role for ipsilateral inhibition in speed control
- Other Figures
- All Figure Page
- Back to All Figure Page
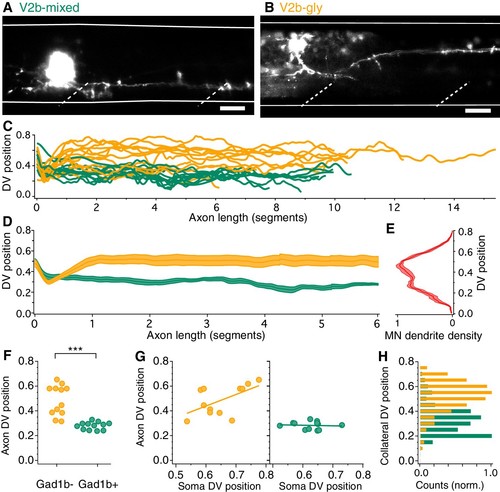
V2b-gly and V2b-mixed neurons have distinct axon morphology and innervation territories.( A) Examples of a V2b-mixed ( Tg(gad1b:GFP)+) and a ( B) V2b-gly ( Tg(gad1b:GFP)-) single-cell dye fill. Dashed lines indicate muscle segments and solid lines indicate the spinal cord dorsal and ventral boundaries. Scale bars = 20 μm. ( C) Axon traces for V2b neurons, aligned at the segment of origin, relative to the spinal cord dorsoventral boundaries (V2b-mixed, green, N = 12; V2b-gly, orange, N = 12 from eight clutches). All axons were exclusively descending. ( D) Mean and SEM of V2b-gly and V2b-mixed axon trajectories. ( E) Motor neuron dendrite fluorescence intensity, measured in Tg(mnx:GFP), relative to the same dorsoventral landmarks. ( F) Mean axon position for each traced axon. ***p<0.0001 (p=8.23×10⁻⁵), Student’s t-test. ( G) Average axon position of V2b-mixed (green, left) and V2b-gly (orange, right) relative to soma position for each neuron. A correlation between soma position and axon position is observed for V2b-gly but not V2b-mixed neurons. V2b-gly: r2 = 0.33, p<0.05, V2b-mixed: r2 = 0.0059, p=n .s. ( H) Axon collaterals of V2b-gly neurons also innervate more dorsal spinal cord territory than V2b-mixed axons. |