
Fig. 4
- ID
- ZDB-FIG-190813-17
- Publication
- Lin et al., 2019 - An Ectoderm-Derived Myeloid-like Cell Population Functions as Antigen Transporters for Langerhans Cells in Zebrafish Epidermis
- Other Figures
- All Figure Page
- Back to All Figure Page
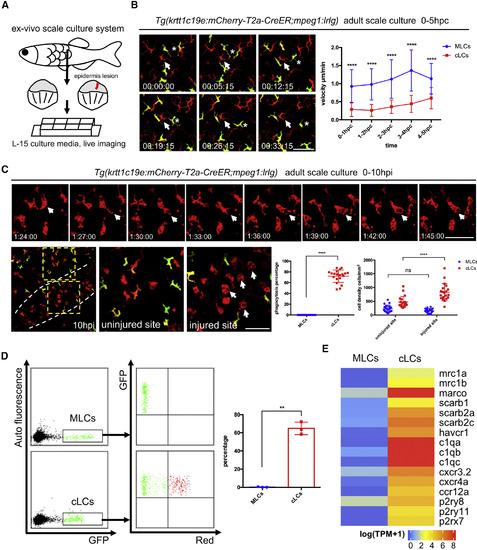
MLCs Have High Mobility but Do Not Respond to Tissue Injury or Bacteria Challenge (A) A diagram of experimental procedure of ex vivo scale culture in normal and injured condition. Scales isolated from adult fish are immediately placed in L-15 culture media with 10% FBS and 1% antibiotics and subjected to time-lapse imaging. Red line indicates epidermal injury. (B) Time-lapse imaging of normal scales from 4-OHT-treated Tg(krtt1c19e:mCherry-T2a-CreERT2;mpeg1:loxP-DsRedx-loxP-GFP) fish. The positions (left panel) of a cLC (DsRedx+) and a MLC (GFP+) at different time points within a 30-min imaging period are indicated by white arrows and white stars, respectively. Scale bar, 50 μm. Quantification data (right panel) show the average velocities of MLCs (blue, n = 30 cells from 6 scales) and cLCs (red, n = 30 cells from 6 scales) during the first 5 h post culture (hpc). (C) Time-lapse imaging of the injured scales from 4-OHT-treated Tg(krtt1c19e:mCherry-T2a-CreERT2;mpeg1:loxP-DsRedx-loxP-GFP) fish. Upper panels show that cLCs (DsRedx+) undergo actively phagocytosis(indicated by the appearance of large vacuoles) in injured site. Scale bar, 50 μm. Lower panels show the accumulation of cLCs (DsRedx+) in injured site at 10 h post injury (the end of time-lapse imaging). White dash lines (left panel) show injured boundary, yellow dash boxes (left panel) indicate enlarged uninjured and injured sites, and white arrows (in the right panel) indicate the cLCs with big vacuoles. Scale bar, 50 μm. Quantification data show phagocytosis ratio of MLCs (blue) and cLCs (red) during time-lapse imaging (1–10 hpi) and cell densities of MLCs (blue) and cLCs (red) at the end of time-lapse imaging (10 hpi) at normal and injured sites (n = 20 scales). (D) FACS analysis of MLCs (GFP+) from Tg(krtt1c19e:mCherry-T2a-CreERT2;mpeg1:loxP-mIFP-loxP-GFP) and cLCs (GFP+) from Tg(drl:mCherry-T2a-Cre;mpeg1:loxP-mIFP-loxP-GFP) incubated with pHrodo Red E. coli. Red+ E. coli are detected in cLCs but not in MLCs. Quantification data (right panel) shows the percentage of the MLCs and cLCs positive for Red+ E. coli. (each group, n = 3 fish). (E) Normalized average gene expression levels [log(TPM+1)] of the well-known chemokine receptors, nucleotide receptors, and scavenger receptors in MLCs and cLCs from RNA-seq data (n = 4). Data are represented as mean ± SD, ∗∗p < 0.01, ∗∗∗∗p < 0.0001. See also Figure S5. |
Reprinted from Developmental Cell, 49(4), Lin, X., Zhou, Q., Zhao, C., Lin, G., Xu, J., Wen, Z., An Ectoderm-Derived Myeloid-like Cell Population Functions as Antigen Transporters for Langerhans Cells in Zebrafish Epidermis, 605-617.e5, Copyright (2019) with permission from Elsevier. Full text @ Dev. Cell