
Fig. 3
- ID
- ZDB-FIG-190802-1
- Publication
- Xue et al., 2019 - A 3D Atlas of Hematopoietic Stem and Progenitor Cell Expansion by Multi-dimensional RNA-Seq Analysis
- Other Figures
- All Figure Page
- Back to All Figure Page
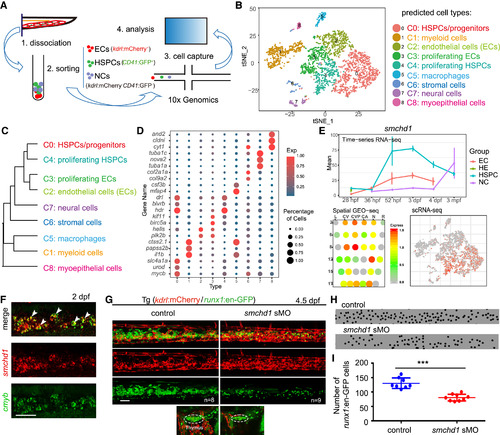
A Single-Cell Resolution Map of Zebrafish CHT (A) The illustration of CHT single-cell RNA-seq (scRNA-seq) at 55 hpf. (B) t-Distributed Stochastic Neighbor Embedding (t-SNE) clustering map of 3,776 single cells from zebrafish CHT. (C) The hierarchy structure of 9 cell clusters. Single cells of the same group were combined together for hierarchical clustering. (D) Dot plot showing representative marker genes of the defined cell groups. Color indicates the ratio between the expression level of each group and the maximum expression level of all groups. Size of the dot is proportional to the percentage of cells expressing this gene (>1) in each group. (E) The expression pattern of smchd1 generated from bulk RNA-seq, GEO-seq, and scRNA-seq, respectively. (F) Double fluorescence in situ hybridization (FISH) analysis showing co-expression of smchd1 and cmyb in the CHT region at 3 dpf. White arrowheadsmark the smchd1+cmyb+ double positive cells. Scale bar, 50 μm. (G) Confocal imaging of the transgenic line (kdrl:mCherry/runx1:en-GFP) showing the number of GFP cells (runx1+) in the CHT and thymus regions in control and smchd1 morphants at 4.5 dpf. Dashed line circles mark the thymus region. ncontrol = 8; nsmchd1 sMO = 9. Scale bar, 50 μm. (H) The black spots mimicked the runx1+ cells in CHT region in (G). (I) The quantification data of runx1+ cells in CHT in control and smchd1morphants, showing as means ± SEM. ∗∗∗p < 0.001. The HSPCs were counted in about 6-somite regions of CHT in control embryos and morphants. |
| Genes: | |
|---|---|
| Fish: | |
| Knockdown Reagent: | |
| Anatomical Terms: | |
| Stage Range: | Long-pec to Day 4 |
| Fish: | |
|---|---|
| Knockdown Reagent: | |
| Observed In: | |
| Stage: | Day 4 |