
FIGURE
Fig. S3
- ID
- ZDB-FIG-191003-1
- Publication
- Xue et al., 2019 - A 3D Atlas of Hematopoietic Stem and Progenitor Cell Expansion by Multi-dimensional RNA-Seq Analysis
- Other Figures
- All Figure Page
- Back to All Figure Page
Fig. S3
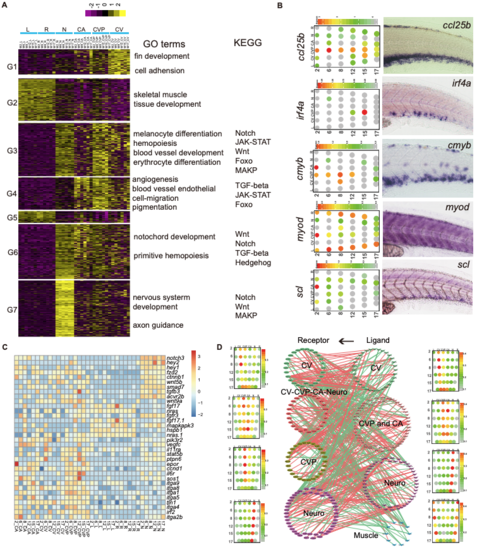
The GEO-seq analysis, related to figure 2. A. BICKmwans clustering of DEGs revealing seven typical expression pattern of all GEO-seq samples. B. The consistancy validation between whole mount in situ hybridization (WISH) data at 2 dpf and corn plots constructed from GEO-seq data for cc125b, irf4a, cmyb, and scl. C. Heatmap showing the region-specific expression of signaling pathway related genes in GEO-seq samples. D. The Connection Specificity Index (CSI) network displays the secretomics regulation among all GEO-seq samples by in silico secretomics analysis. |
Expression Data
Expression Detail
Antibody Labeling
Phenotype Data
Phenotype Detail
Acknowledgments
This image is the copyrighted work of the attributed author or publisher, and
ZFIN has permission only to display this image to its users.
Additional permissions should be obtained from the applicable author or publisher of the image.
Full text @ Cell Rep.