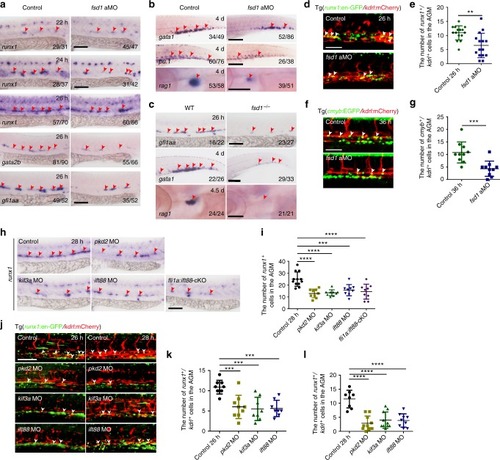
Cilia are required for hemogenic endothelium (HE) specification. a Whole-mount in situ hybridization (WISH) analysis showing the expression of HE markers, runx1, gata2b, and gfi1aa, in the aorta-gonad-mesonephros (AGM) region at 22, 24, and 26 hpf. Red arrowheads denote the expression of HE markers. b Expression of erythroid marker (gata1), myeloid marker (pu.1) in the caudal hematopoietic tissue (CHT) and T cell marker (rag1) in the thymus at 4 dpf. Red arrowheads mark the corresponding hematopoietic cells. c The expression of HE marker gfi1aa, erythroid marker gata1, and T cell marker rag1 in fsd1−/−. Red arrowheads mark the corresponding hematopoietic cells. d, e The imaging of kdrl:mCherry+/runx1:en-GFP+ HE cells (white arrowheads) in the AGM region in control and fsd1 morphants with quantification (e) at 26 hpf. Error bars, mean ± s.d., n = 15 embryos. **P < 0.01, Student’s t-test. f Confocal imaging of HE cells (kdrl:mCherry+/cmyb:EGFP+) in control and fsd1 morphants at 36 hpf. White arrowheads denote HE cells. g The quantification of kdrl:mCherry+/cmyb:EGFP+ HE cells in control and fsd1 morphants at 36 hpf. Error bars, mean ± s.d., n = 10 embryos. ***P < 0.001, Student’s t-test. h, i Representative images of runx1 expression (red arrowheads) in control and cilia-impaired embryos with quantification (i) at 28 hpf. Red arrowheads denote runx1+ cells in the AGM region. j–l High-resolution imaging of HE cells (kdrl:mCherry+/runx1:en-GFP+) in control and cilia-impaired embryos with quantification (k, l). White arrowheads indicate kdrl:mCherry+/runx1:en-GFP+ cells in the AGM region. Data represent the analysis results of one-way ANOVA–Dunnett test. Error bars, mean ± s.d., n = 12, 9, 9, 9, 9 embryos (i). n = 9, 9, 8, 8 embryos (k). n = 8, 10, 10, 9 embryos (l). ***P < 0.001, ****P < 0.0001. Scale bars, 100 µm
|
