
Fig. 1
- ID
- ZDB-FIG-190624-7
- Publication
- Cao et al., 2019 - Germline Stem Cells Drive Ovary Regeneration in Zebrafish
- Other Figures
- All Figure Page
- Back to All Figure Page
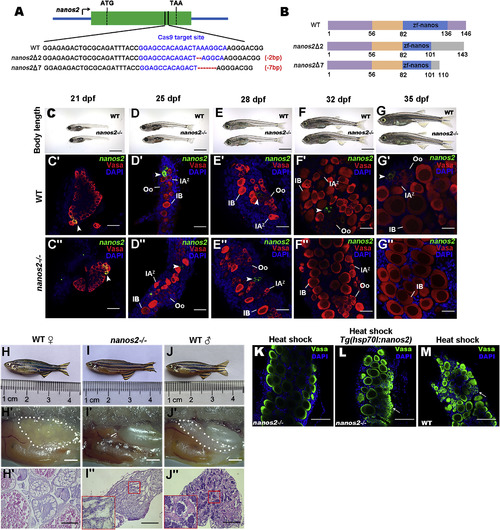
nanos2 Is Required for Maintaining GSCs (A) Schematic diagram of nanos2 genomic structure and mutation genotypes. (B) Schematic representation of the protein functional domains of nanos2 from wild-type (WT) and two kinds of mutants (Zf-nanos, Zinc finger-nanos). (C–G) Body length of wild-type (WT) and nanos2homozygous at 21 (C), 25 (D), 28 (E), 32 (F), and 35 (G) dpf. (C′–G″) Triple fluorescent labeling with FISH-nanos2, anti-Vasa antibodies, and 4′,6-diamidino-2-phenylindole (DAPI) staining in the ovaries of wild-type and nanos2 homozygous at 21, 25, 28, 32, and 35 dpf. Note loss of GSCs (arrowheads) in the mutant starting at 32 dpf. (H–J) Adult wild-type female (H), the nanos2 mutant (I), and wild-type males (J). (H′–J′) Lateral views of gonads. (H″–J″) H&E staining of gonad sections shows that all of the nanos2 mutants develop into the sterile males. (K–M) At 40 dpf after heat-shock, double staining by anti-Vasa antibodies, and DAPI in the nanos2 mutants with (L) or without (K) Tg(hsp701:nanos2) transgenic background, and in the wild-type (M) shows that overexpression of nanos2 could rescue the phenotypes of nanos2 mutant. Arrows indicate early germ cells. Oo, oogonia; IAz, zygotene-stage-IA; IB, stage IB oocyte. Scale bars: 500 μm (C–G), 50 μm (C′–G′′), 1 mm (H′–J′), 200 μm (H′′–J′′), 50 μm (K–M). See also Figure S1.
|
| Gene: | |
|---|---|
| Antibody: | |
| Fish: | |
| Condition: | |
| Anatomical Terms: | |
| Stage Range: | Days 21-29 to Days 30-44 |
| Fish: | |
|---|---|
| Observed In: | |
| Stage Range: | Days 21-29 to Days 30-44 |