
Fig. 3
- ID
- ZDB-FIG-190624-9
- Publication
- Cao et al., 2019 - Germline Stem Cells Drive Ovary Regeneration in Zebrafish
- Other Figures
- All Figure Page
- Back to All Figure Page
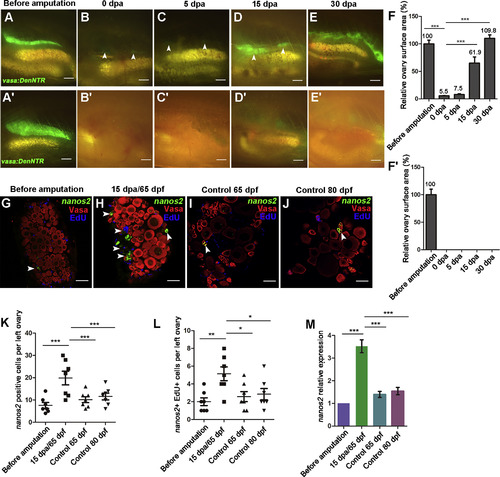
Residual GSCs Are Highly Proliferative during Ovary Regeneration (A–E) Most of the left ovary was removed and could be completely recovered in a month. Zebrafish ovary at 50 dpf/before amputation (A), 0 (B), 5 (C), 15 (D), and 30 (E) dpa. Arrowheads indicate the remaining or regenerating ovarian tissues (n = 5). (A′–E′) Complete amputation of the left ovary causes failure of regeneration (n = 5). (F and F′) Quantification of ovary surface area at 0, 5, 15, and 30 dpa. Values represent the size of the largest left ovary surface area (n = 5, mean ± SEM, ∗∗∗p < 0.001, two-tailed t test, error bars indicate SEM). (G–J) Triple fluorescent labeling of ovaries with FISH-nanos2, anti-Vasa antibodies, and EdU at different stages including 50 (G), 65 (I), and 80 (J) dpf without amputation, as well as 15 dpf/65 dpf after amputation (H). Note the increased number and proliferation of nanos2-positive cells (arrowheads) at 15 dpa. (K) Quantification of nanos2-positive cells per left ovary before amputation and at 15 dpa, 65 dpf, and 80 dpf (n = 7, mean ± SEM, ∗∗∗p < 0.001, two-tailed t test, error bars indicate SEM). (L) Quantification of nanos2+ EdU+ double-positive cells per left ovary before amputation and at 15 dpa, 65 dpf, and 80 dpf. (n = 7, mean ± SEM, ∗∗p < 0.01, ∗p < 0.05, two-tailed t test, error bars indicate SEM). (M) nanos2 expression level measured by qRT-PCR (n = 7, mean ± SEM, ∗∗∗p < 0.001, two-tailed t test, error bars indicate SEM). Scale bars: 1 mm (A–E′), 50 μm (G–J). See also Figure S3. (F–F″) Testis (arrowheads) that lack germ cells appears at 90 dpt, showing that the females treated with Mtz reverted to sterile males. Oo, oogonia; IAz, zygotene-stage-IA; IA, stage IA oocytes; IB, stage IB oocyte; II, stage II oocyte; III, stage III oocyte; IV, stage IV oocyte; V, stage V oocyte. Scale bars: 50 μm (A), 1 mm (B–F′), 200 μm (B″–F″). See also Figure S2. |
| Fish: | |
|---|---|
| Conditions: | |
| Observed In: | |
| Stage: | Days 45-89 |