
Fig. 1
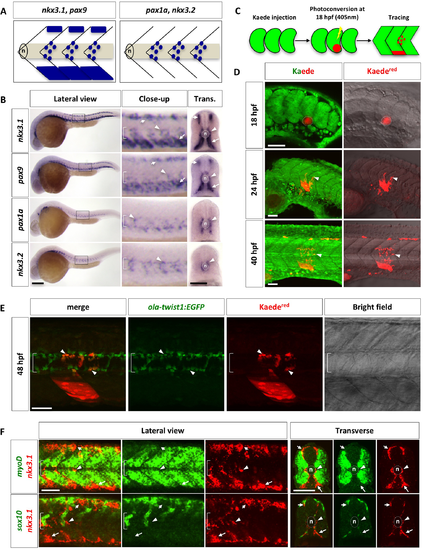
Characterization of the zebrafish sclerotome. (A) Schematic representation of two patterns of sclerotome marker expression. nkx3.1 and pax9 are expressed in both the dorsal and ventral sclerotome domains along with sclerotome derived notochord associated cells. In contrast, pax1a and nkx3.2 are expressed only in sclerotome derived notochord associated cells. Lateral views of three somites are shown with the notochord (n) indicated. (B) Expression of sclerotome markers in wild-type zebrafish at 24 hpf in lateral and transverse (Trans.) views. Close-up images are expanded views of boxed regions in lateral images. nkx3.1 and pax9 are expressed in three regions: a small domain at the dorsomedial edge of the somite (short arrows), a large domain at the ventromedial region of the somite (long arrows), and cells surrounding the notochord (arrowheads). In contrast, pax1a and nkx3.2 are expressed only in cells around the notochord. The notochord (n) is indicated by brackets in close-up views and by dotted lines in transverse views. n = 60 embryos per staining. (C) Schematic drawings of Kaede lineage tracing experiment. Kaedegreen in the presumptive ventral sclerotome of a single somite at 18 hpf was photoconverted to Kaedered and followed over time. (D) Lineage tracing of sclerotome derived cells from the ventral sclerotome domain using Kaede. The presumptive ventral sclerotome domain (indicated by dotted line) was photoconverted to Kaedered at 18 hpf. At 24 hpf, a few sclerotome derived cells (arrowheads) were seen surrounding the notochord. By 40 hpf, many sclerotome derived cells have populated the region surrounding the notochord. n = 35 embryos. (E) Lineage tracing of sclerotome derived cells using Kaede in ola-twist1:EGFP transgenic line. ola-twist1:EGFP embryos were injected with Kaede mRNA at the one-cell stage, and photoconverted in the ventral region of a single somite at 18 hpf as described in (C). At 48 hpf, the red channel was first imaged to identify Kaedered expressing cells, then the Kaedegreen signal was completely photoconverted, and finally, the green channel was imaged in the same z-stack to reveal ola-twist1:EGFP positive cells. Most Kaedered sclerotome derived cells surrounding the notochord are positive for ola-twist1:EGFP (arrowheads). n = 21 embryos. (F) Wild-type embryos were co-labeled with the myotome marker myoD (green, top panel), or the neural crest marker sox10 (green, bottom panel) with nkx3.1 (red). nkx3.1-expressing dorsal sclerotome (short arrows), ventral sclerotome (long arrows), and sclerotome derived notochord associated cells (arrowheads) do not express either myoD or sox10. Images shown are lateral and transverse views of embryo at 24 hpf. n = 30 embryos per staining. Scale bars: (B) 200 μm in lateral views, 50 μm in transverse views; (D, E, F) 50 μm. |