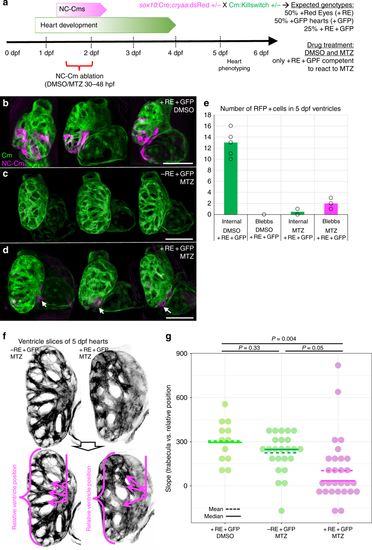
NC-Cm ablation alters trabeculae patterning. a Schematic of NC-Cm ablation protocol. Tg(Cm:KillSwitch) and Tg(sox10:cre;cryaa:dsRed) heterozygotes were crossed to generate three genotypes: Tg(Cm:KillSwitch) ( + GFP); Tg(sox10:cre:cryaa:dsRed) ( + RE); or double-transgenic ( + RE + GFP). Double-transgenic embryos were treated with DMSO (control) or MTZ from 30–48hpf to ablate NC-Cms. Sibling Tg(Cm:KillSwitch (-RE + GFP) were treated with MTZ as a drug control. Embryos were phenotyped at 5 dpf. b–d Confocal maximum intensity projection images from three hearts at 5 dpf from each condition. NC-Cm cells (tagRFP + ) were absent from the MTZ)-treated + RE + GFP embryos compared with their DMSO treated sibling controls (d compared with b). White arrows indicate a remnant, extruding NC-Cm as a consequence of cell death. Scale bar = 100 µm. e Quantification of the number of tagRFP + cells in the 5 dpf ventricle (“internal”) in control (DMSO + RE + GFP) and NC-CM ablated embryos (MTZ + RE + GFP). Bars are mean of individual hearts (open circles) quantified in each condition. Individual protrusions from the ventricle (“blebbs”) that were tagRFP + were also quantified. f Trabeculation analysis of control and NC-Cm-ablated hearts at 5 dpf. Control hearts (left panels) had an array of trabeculae with primary branches arranged along anterior–posterior coordinate. In contrast, NC-Cm-ablated ventricles (from protocol in a) had poorly organized trabeculae (right panels). The angle of the primary branch of a trabecula and relative anterior–posterior position of the primary branch within the ventricle were measured as shown in bottom panel, magenta arrows depict primary trabecula branch; relative position in ventricle axis as represented by bracket. The position and angle of the primary trabeculae branches were measured relative to the AV canal. These data were collected for controls (-RE + GFP, MTZ treated) and NC-Cm-ablated hearts ( + RE + GFP, MTZ treated) and a slope was computed using the trabecula angle to position data for each individual heart (see Supplementary Figure 7). g Computed slope values for individual hearts in each treatment. Mean is indicated by the dashed line and median by the solid line. The slope measurement was significantly different for NC-Cm-ablated hearts compared with their sibling controls. P-values computed by TukeyHSD on ANOVA (F(62,60) = 3.31)
|
