
Fig. 3
- ID
- ZDB-FIG-181019-35
- Publication
- Yin et al., 2018 - Spatiotemporal Coordination of FGF and Shh Signaling Underlies the Specification of Myoblasts in the Zebrafish Embryo
- Other Figures
- All Figure Page
- Back to All Figure Page
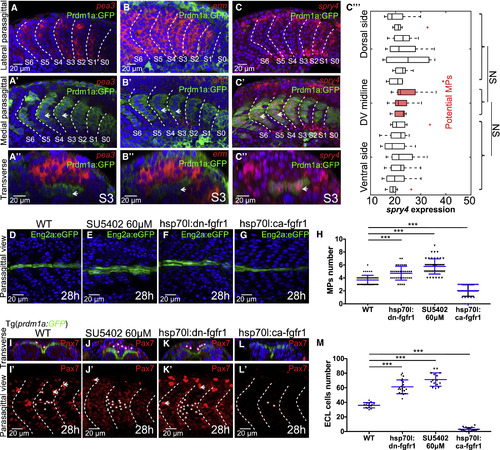
FGF Signaling Participates in the Further Differentiation of Both Slow and Fast Muscle Lineages (A–C) Fluorescent in situ of FGF downstream activators pea3 (A–Aʹʹ) and erm (B–Bʹʹ) and inhibitor spry4 (C–Cʹʹ). Images are taken at the lateral somitic cells (A–C) and the slow muscle fibers (Aʹ–Cʹ) at 18-somite stage. Constructed transverse images are taken at somite S3 and are displayed in (Aʹʹ–Cʹʹ) with lateral to the top and dorsal to the left. Slow muscles are labeled with Prdm1a:GFP and white short arrows. (Cʹʹʹ) Spry4 expression level per cell along the DV axis. The expression of spry4 is measured cell by cell by calculating the average intensity within the nucleus (nCells = 153, from total of 9 somites taken from 5 embryos, NSp > 0.05, Student’s t test). (D–H) Perturbations of FGF signaling change the number of MPs with MPs identified by Eng2a:eGFP expression. Wild-type embryo (D), SU5402 treatment at 60 μM (E), heat shock of hsp70l:dn-fgfr1-eGFP (F), and heat shock of hsp70l:ca-fgfr1 (G) analyzed, all imaged at 28 hpf at muscle segments 16–20, with quantification of MP number shown in (H), where nSegments = 55, 60, 40, and 40 (from 11, 12, 10, and 10 embryos) for conditions (D–G), respectively. (I–L) Perturbations of FGF signaling change the number of ECL cells, with ECL cells identified by Pax7 antibody staining. White asterisks label ECL cells with moderate Pax7 intensity. The much brighter cells labeled with white short arrows are neural crest cells. Wild-type embryo (I and Iʹ), SU5402 treatment at 60 μM (J and Jʹ), heat shock of hsp70l:dn-fgfr1 (K and Kʹ) and heat shock of hsp70l:ca-fgfr1 (L and Lʹ) analyzed at 28 hpf at muscle segments 16–20. Transverse views shown in (I–L) with lateral to the top and dorsal to the left. (M) Quantification of ECL cell number, where nSegments = 16, 21, 15, and 19 (from 6 embryos in each condition) for conditions (I–L), respectively. ∗∗∗p < 0.001, Student’s t test. |
| Genes: | |
|---|---|
| Antibody: | |
| Fish: | |
| Conditions: | |
| Anatomical Terms: | |
| Stage Range: | 14-19 somites to Prim-5 |
| Fish: | |
|---|---|
| Conditions: | |
| Observed In: | |
| Stage: | Prim-5 |
Reprinted from Developmental Cell, 46, Yin, J., Lee, R., Ono, Y., Ingham, P.W., Saunders, T.E., Spatiotemporal Coordination of FGF and Shh Signaling Underlies the Specification of Myoblasts in the Zebrafish Embryo, 735-750.e4, Copyright (2018) with permission from Elsevier. Full text @ Dev. Cell