
Fig. S2
- ID
- ZDB-FIG-181019-41
- Publication
- Yin et al., 2018 - Spatiotemporal Coordination of FGF and Shh Signaling Underlies the Specification of Myoblasts in the Zebrafish Embryo
- Other Figures
- All Figure Page
- Back to All Figure Page
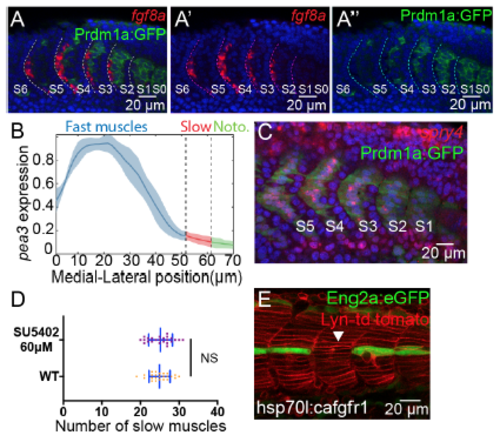
FGF target RNA expression in the myotome and phenotypes of FGF perturbations, related to Figure 3 (A-A’’) Fluorescent in situ of fgf8a from somite S0 to S6 at the parasagittal optical view. Slow muscles are labeled with Prdm1:GFP. Fgf8a and Prdm1:GFP are separately displayed in (A’) and (A’’). Images are taken at somite 15-21 (S6-S0). (B) Quantification of pea3 intensity along the ML axis (nSomites=6 from 6 different embryos). (C) Spry4 expression in somite S1 to S6 by fluorescent in situ of a 20-somite stage embryo. (D) Distribution of the number of slow muscles per muscle segment at segments 10-18 in wild type embryos and embryos under SU5402 treatment at 60μM, where in both conditions nSomites=24 from 5 different embryos. NSP >0.05, Student’s t test. (E) Eng2a:GFP expression under heat shock of hsp70l:ca-fgfr1. White triangle labels the muscle segment that has no MP. Images are taken at muscle segments 18-21 at 30hpf. |
Reprinted from Developmental Cell, 46, Yin, J., Lee, R., Ono, Y., Ingham, P.W., Saunders, T.E., Spatiotemporal Coordination of FGF and Shh Signaling Underlies the Specification of Myoblasts in the Zebrafish Embryo, 735-750.e4, Copyright (2018) with permission from Elsevier. Full text @ Dev. Cell