
Fig. 1
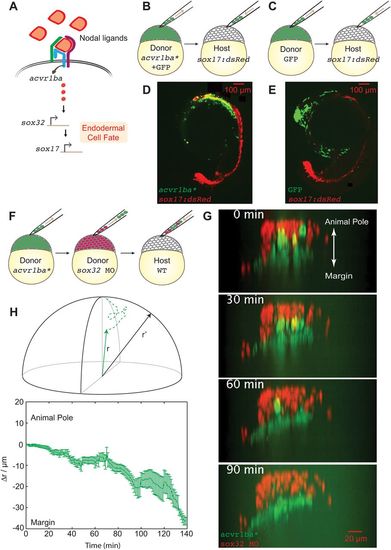
Constitutively active Nodal receptor (acvr1ba*)-induced ectopic endodermal cells sort into the inner layer of the embryo by ingression. (A) Schematic depicting Nodal signaling and specification of endodermal cell fate. Nodal ligands activate the Acvr1ba receptor and signal to sox32, a transcription factor controlling endodermal specification. (B-E) Schematics of the ectopic endoderm transplant assay (B,C) and representative results (D,E). acvr1ba*-expressing or control cells were transplanted to the animal pole of Tg(sox17:dsRed) host embryos. At 21-somite stage, transplanted acvr1ba*-expressing cells localized to endoderm-derived tissue, primarily the pharynx (D), whereas control transplanted cells localized to non-endodermal tissue, particularly the head (E). (F) Schematic of the double donor transplant assay. Donor endodermal cells expressing acvr1ba* (green) were transplanted together with non-endodermal donor cells injected with sox32 MO (red) to the animal pole of a single wild-type (WT) host. (G) Images from a time-lapse movie of a wild-type host containing both acvr1ba*-expressing (green) and sox32 MO-containing (red) donor cells. Time lapse microscopy began immediately after transplantation (0 min). Over time, sox32 MO donor cells remain in the outer layer of the embryo, whereas acvr1ba*-expressing donor cells migrate into the inner layer of the embryo. Data were re-sliced and projected onto the xz plane, with the animal pole towards the top and the margin towards the bottom. (H) Single-cell tracking analysis of ingression. Top: Cartesian coordinates for transplanted cells were transformed into spherical coordinates. Dashed lines represent cell trajectories. The radial distance, r, was measured as the distance from each cell's position at the end of the time-lapse movie to the center of the embryo (solid lines). r′ was measured as the distance to the host surface for normalization. Bottom: Average relative distance (±s.e.m.) of acvr1ba*-expressing cells plotted against time. Relative distance for each time point was calculated by measuring the radial distance of acvr1ba*-expressing cells to the center of the embryo, subtracted by the distance of host cell expanding during gastrulation. |