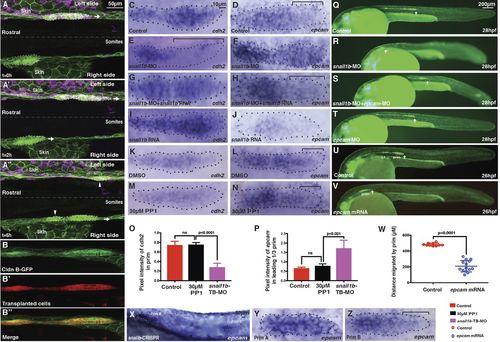
Snail1b is required in the migrating primordium for effective migration and its loss has reciprocal effects on of cdh2 and epcam expression. (A-A″) Stills from a time-lapse movie of pLL primordia migration in snail1b morphant embryo (Movie 3) at 0 h (A), 2 h (A′) and 6 h (A″). The dorsal view shows the left and right primordia. Transplanted wild-type cells (magenta) are localized in the left primordium and overlying skin but not in underlying horizontal myoseptum. (B-B″) Example of a primordium in a TB-MO-injected Cldn B:lynGFP transgenic embryo with transplanted cells from a non-morphant donor embryo but without transplanted cells in the underlying horizontal myoseptum cells. Transplanted cells are labeled with rhodamine-dextran. (C-J) Expression of cdh2 and epcam in control primordia (C,D), in snail1b-TB morphants (E,F), in snail1b-TB morphants co-injected with snail1b RNA (G,H) and in snail1b mRNA-injected embryos (I,J). (K-N) cdh2 and epcam expression in DMSO- and PP1-treated embryos. (O,P) Quantification of cdh2 and epcam expression following inhibition of migration by the Src inhibitor PP1 and in snail1b morphants. Error bars represent standard error of the mean. (Q-S) Reversal of slower primordium migration defect in snail1b morphants by co-injection of epcam morpholinos. Arrow shows position of the primordium. (T) Primordium migration is similar to controls in embryos injected with epcam-MO alone. (U,V) Ectopic expression of epcam mRNA slows migration of the primordium (prim). (W) Distance migrated by control and epcam mRNA-injected embryos. Error bars represent standard error of the mean. (X-Z) epcam expression expands into the leading zone of slower migrating primordia of snail1b CRISPR-injected embryos. X show a lower magnification of the embryo shown in Y,Z, which show the slower migrating primordium (Prim A) and the contralateral faster migrating primordium (Prim B). The primordium with delayed migration (Y) has expanded epcam expression in the leading domain compared with the contralateral side (Z), where there is a lower level of expression in the leading domain. n=13 for transplants, n=25 for each of two independent experiments for in situ hybridization. n=20 and 14 for each of two independent experiments of epcam rescue and overexpression, respectively. Dotted lines encircle pLL primordia.
|
