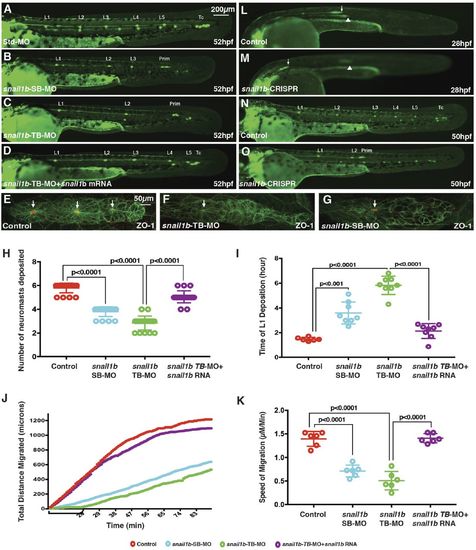
Delayed neuromast formation and primordium migration following reduction of snail1b function. (A-D) The pattern of neuromast deposition visualized in CldnB:lyn-GFP embryos at 52 hpf in control (A), snail1b splice-blocking morpholino (SB-MO)-injected embryos (B), snail1b translation-blocking morpholino (TB-MO)-injected embryos (C) and snail1b-TB morphants co-injected with snail1b mRNA (D). (E-G) Expression of ZO-1 (red) in a control embryo (E), a TB morphant (F) and an SB morphant (G). Arrows indicate ZO-1 at apical constriction of protoneuromasts. (H) Graphs comparing the number of neuromasts deposited (H) and time of first neuromast (L1) deposition (I) in various experimental conditions. (J) Plot comparing the total distance travelled by the primordium with time in control, SB-MO-injected, TB-MO-injected, and TB-MO and snail1b mRNA co-injected embryos. Bracket below the x-axis highlights the delay in initiation of migration in snail1b morphants. (K) Comparison of the average migration speed of the primordium. Significance in H,I and K was determined by Student's unpaired t-test. In H,I,K, error bars represent standard error of the mean. (L,M) Primordium position (arrow) in a control embryo at 28 hpf (L) and in a snail1b-CRISPR-injected embryo (M). Arrow shows primordium on one side with delayed migration, and arrowhead points to slightly out of focus primordium on the contralateral side at a position similar to that in control embryos. (N,O) Pattern of neuromast deposition in a control embryo (N) and an example of a snail1b-CRISPR-injected embryo with fewer neuromasts and incomplete primordium migration (O) at 50 hpf. n=20 for each of three and two independent morpholino and CRISPR experiments, respectively. Prim, primordium; Tc, terminal cluster.
|
